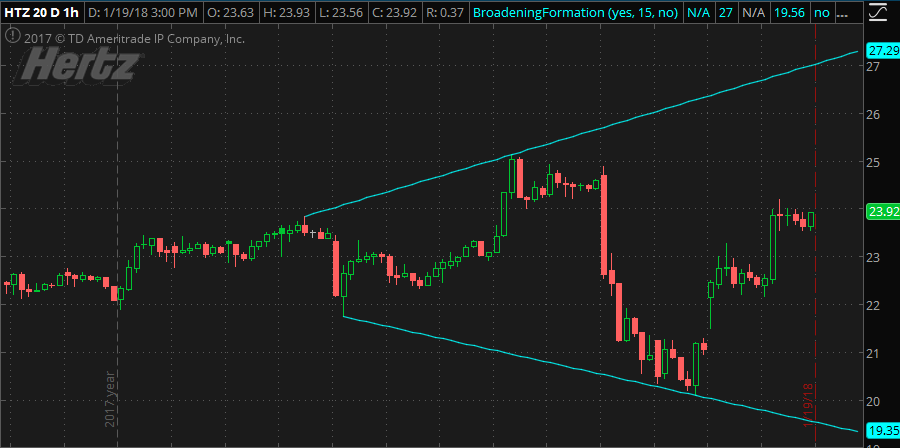
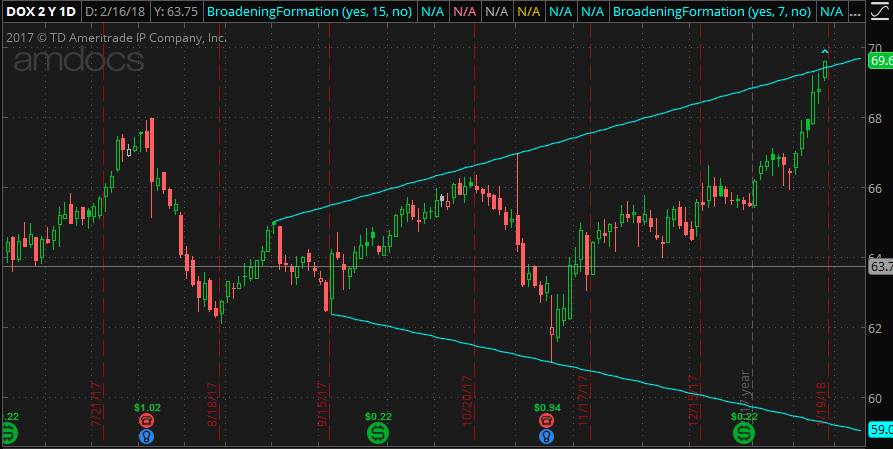
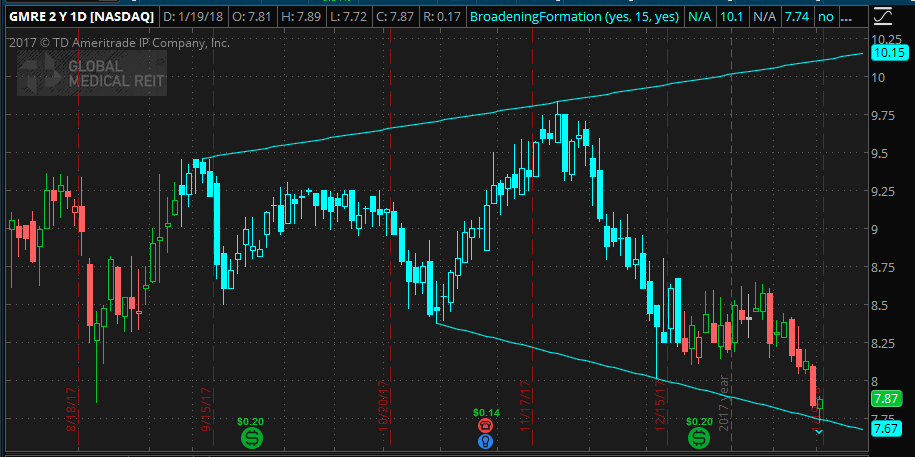
Broadening Formation is a chart pattern consisting of 2 trendlines.
- The resistance (upper) line is formed by 2 or more ascending peaks.
- The support (lower) line is formed by 2 or more descending troughs.
- It can be considered as the boundary of incoming HIGHs and LOWs until a breakout occurs.

This indicator will be able to detect the Broadening Formation chart pattern.
It will draw two trend lines of the Broadening Formation on chart when the pattern is formed.
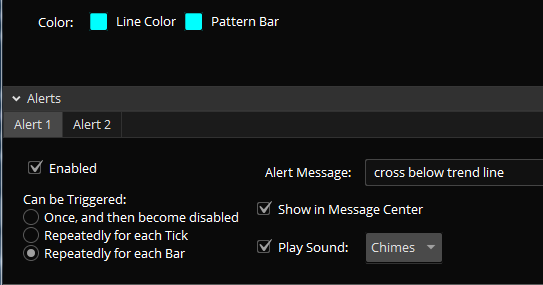
It works on all timeframes. Alerts will be triggered when price cross above the upper trend line or cross below the lower trend line. There will be a wedge drawn above/below the current bar whenever a crossover occurs.
The pattern detection is based on four swing points, two swing highs and two swing lows.
You can control the size of pattern you want to detect by changing the value of Input Strength: the number of bars on the left and right side of the swing high and low.
The upper trend line is formed by point A and B, the lower trend line is formed by point C and D. Please check the chart below.
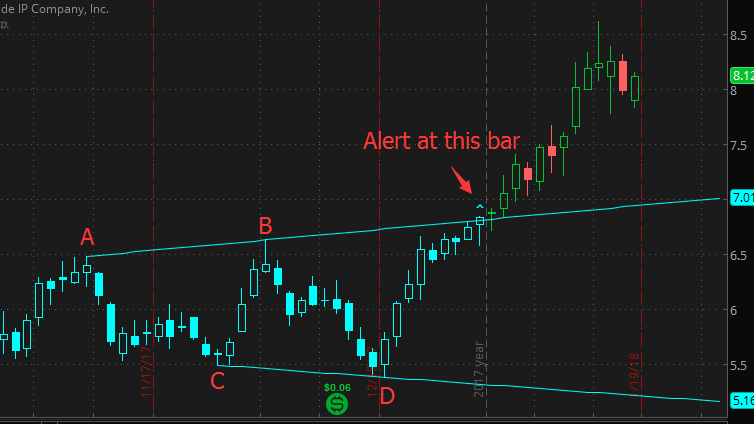
If we set Strength to 5, it means the high at A is higher than the highs of on both of its left and right side for 5 bars, same for point B. And the price low at C is lower than 5 bars on both left and right side, same for point D.
The larger value you set for “Strength” the bigger size of the pattern you will get.
You can also change the color of the trend lines and the color to highlight the pattern.
Please make sure you use the same “strength” input on both scan and indicator, otherwise, you may not get the plot on chart. For example, you have “strength”=10 in scan and
“strength”=5 on chart indicator, when you load the scan result symbols on chart, there may not no pattern drawn.
There are 5 scans. If there is no scan result, please try with different input.
# scantype=1; for price cross above upper line
# scantype=2; for price cross below lower line
# scantype=3; for price is below lower line
# scantype=4; for price is above upper line
# scantype=5; for price is inside two lines.
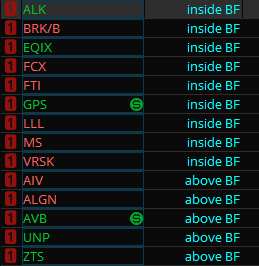
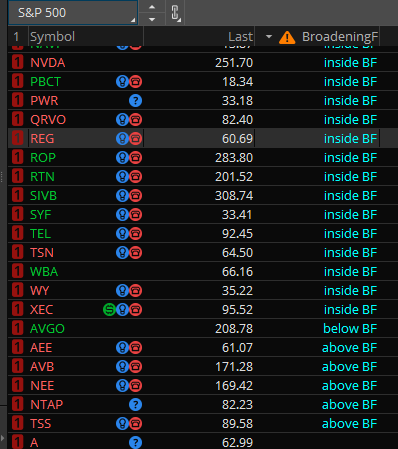
The watchlist column will display in 5 status of current price related to Broadening Formation chart pattern.
“inside BF” which means the current price bar is in between the upper and lower trend lines.
“above BF” which means the current price bar is above the upper trend line.
“below BF” which means the current price bar is below the lower trend line.
“cross below BF” which means the current price bar is cross below the lower trend line.
“cross above BF” which means the current price bar is cross above the upper trend line.
Please note that if you have too many symbols in your watchlist, Thinkorswim may not be able to display the labels due to its limitation.
You can always load this indicator more than once with different input to get more results.


In order to be more efficient, this indicator will only show the most recent Broadening Formation pattern on chart.
NICEEEE!!!! Where to download this script ?
Please check https://www.patternsmart.com/cart/index.php?route=product/product&product_id=430&search=Broadening+Formation+chart+pattern+indicator+
very nice
Hi, how can I gain access to this indicator for think or swim. The automatic broadening formation with alert and scan.
https://www.patternsmart.com/cart/index.php?route=product/product&path=65_131&product_id=430