Professional Trend Strength and Double Divergence Analysis
Understanding whether a trend is genuinely strong—or simply continuing because price has not yet changed direction—is an important part of technical analysis.
ADX Double Divergence Pro for ProRealTime combines the analytical perspective of ADX with PatternSmart’s Double Divergence methodology to help traders evaluate trend strength, trend quality, directional conviction, and potential trend continuation.
Rather than treating divergence as an automatic reversal signal, the indicator provides additional evidence that can be evaluated alongside price action, market structure, and other technical information.
Designed specifically for ProRealTime, the indicator integrates Double Divergence analysis into a professional, visually focused charting workflow.
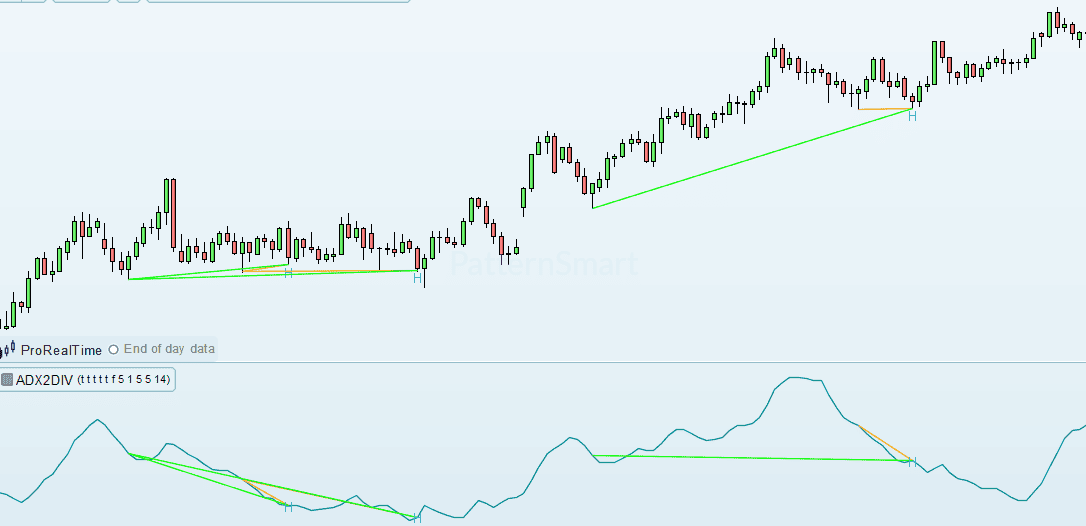
What Is ADX Double Divergence?
The Average Directional Index (ADX) measures the strength of a trend rather than its direction.
This distinction is important.
A market can be moving upward while its underlying trend strength is weakening. Likewise, price can temporarily pull back while the broader trend remains structurally strong.
ADX Double Divergence examines the relationship between price movement and ADX behavior to identify situations where these two observations begin to diverge.
When price continues advancing or declining while ADX fails to confirm the same level of trend strength, the observation may indicate that trend quality is changing.
This does not necessarily mean that a reversal will occur. A weakening trend can continue for some time. Instead, the divergence provides additional information that may justify closer examination of the market environment.
Why Trend Strength Matters
Price direction alone does not tell the complete story.
Two markets can both be making higher highs, for example, while having very different levels of underlying trend strength. One may be developing a sustained directional move, while another may be advancing with progressively weaker conviction.
ADX provides a way to examine this difference.
With Double Divergence analysis, traders can investigate questions such as:
- Is the existing trend maintaining its underlying strength?
- Is trend quality weakening while price continues in the same direction?
- Does a pullback appear consistent with the broader trend?
- Is there additional evidence supporting trend continuation?
- Does price action confirm or contradict the indicator’s message?
This makes ADX Double Divergence particularly relevant for traders who focus on trend confirmation rather than simply identifying price direction.
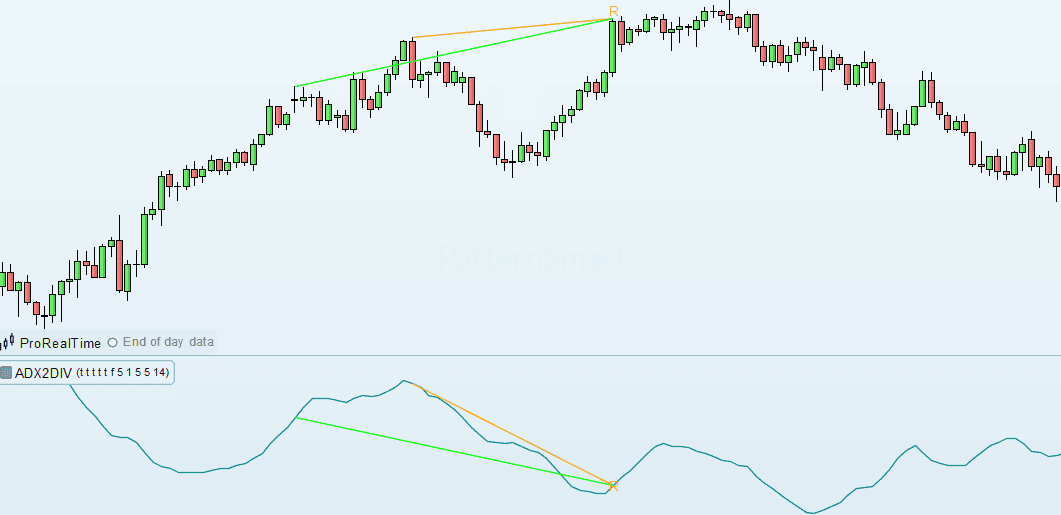
Regular Double Divergence: Evaluating Potential Trend Weakness
Regular Divergence occurs when price establishes a new extreme while the selected indicator fails to confirm that movement.
With ADX, this can provide evidence that the quality or strength of the existing trend is changing.
For example, if price continues making higher highs while ADX produces a lower high, the market may still be bullish, but the underlying trend strength is no longer confirming the same degree of price expansion.
This can be interpreted as potential evidence of declining trend quality, rather than as an automatic reversal signal.
Similarly, when price makes lower lows while ADX fails to confirm the same level of trend strength, traders may want to examine whether bearish trend conditions are losing strength.
Regular Double Divergence is therefore particularly useful for asking:
Is the trend still being supported by the same level of underlying strength?
The answer is not necessarily yes or no. The divergence is analytical evidence that should be evaluated within broader market context.
Hidden Double Divergence: Evaluating Trend Continuation
Hidden Divergence has a different analytical purpose.
Rather than primarily questioning an existing trend, Hidden Divergence can provide evidence that the broader trend may remain intact despite a temporary correction or pullback.
This makes Hidden Double Divergence especially relevant when analyzing established trends.
For example, during a bullish trend, price may form a higher low while the indicator forms a lower low. This bullish Hidden Divergence may suggest that the underlying bullish condition continues to receive support despite temporary weakness.
In a bearish trend, the opposite structure may provide information about continued bearish conditions.
For ADX specifically, Hidden Divergence can be valuable because the indicator’s primary purpose is evaluating trend strength and sustainability. It can therefore add another perspective when assessing whether a pullback represents a meaningful deterioration of the trend or simply a temporary correction.
As always, the broader trend, market structure, price action, and additional confirmation remain important.
ADX Double Divergence Is About Confirmation, Not Prediction
PatternSmart’s Double Divergence methodology is fundamentally confirmation-based.
A divergence is not presented as a guaranteed reversal, automatic entry signal, or prediction engine.
Instead, it represents a difference between price behavior and indicator behavior that may provide useful information about changing market conditions.
A practical analytical sequence is:
Observe → Compare → Confirm → Interpret → Evaluate → Decide
This approach encourages traders to consider Double Divergence as one component of a broader technical-analysis process rather than treating an individual signal in isolation.
Additional confirmation may come from:
- Price action
- Market structure
- Support and resistance
- Trend conditions
- Higher-timeframe analysis
- Other technical tools
The objective is not to eliminate uncertainty. It is to organize available evidence more effectively.
Built for ProRealTime Chart Analysis
ProRealTime is a professional charting and trading platform recognized for high-quality visualization, integrated analysis, and an emphasis on precision and efficient technical analysis.
Its users commonly include technical analysts, professional discretionary traders, swing traders, and position traders working across stocks, futures, Forex, CFDs, and indices.
The platform places considerable emphasis on chart interpretation and visual analysis, making it a natural environment for studying divergence and trend structure.
ADX Double Divergence Pro is designed to fit this workflow by bringing structured Double Divergence analysis directly into the ProRealTime chart environment.
Important ProRealTime Implementation: Two Separate Indicators
Why Two Indicators Are Required
Due to a limitation of ProRealTime’s charting/display implementation, ADX Double Divergence Pro for ProRealTime must be used as two separate indicator instances.
One indicator is placed on the main chart, while the second indicator is placed in a subchart.
This two-indicator arrangement is required to properly display the complete visual information, including the relevant lines and signal characters.
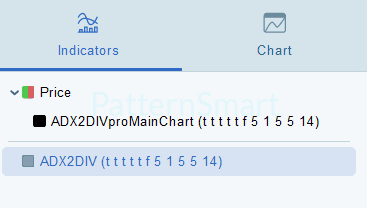
Main Chart Indicator
The main-chart instance is used to display the Double Divergence information that needs to appear directly alongside price.
This allows divergence structures and their associated visual elements to be interpreted in relation to the actual market structure.
Subchart Indicator
The second instance is placed in a subchart so that the ADX-related indicator information and supporting visual elements can be displayed in their appropriate chart area.
Using the two instances together provides the intended visual presentation within ProRealTime despite the platform’s display limitation.
This is a ProRealTime implementation requirement—not a change to the Double Divergence methodology or analytical engine.
The underlying methodology remains consistent across PatternSmart’s supported platforms; platform differences affect implementation and workflow rather than the analytical principles themselves.
Key Double Divergence Pro Features
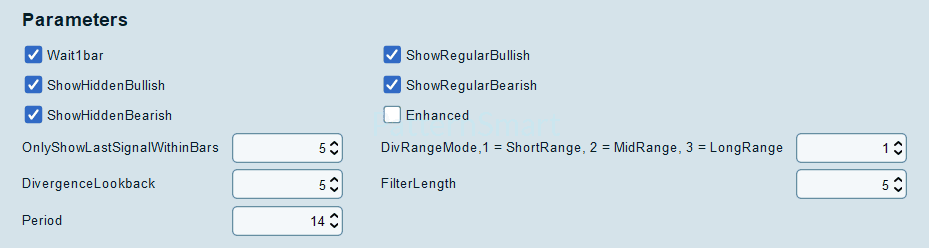
ADX Double Divergence Pro provides configurable controls for signal generation, structural filtering, visualization, and alerts.
Signal Generation
The indicator can be configured to display the primary Double Divergence categories, including:
- Show Regular Bullish
- Show Regular Bearish
- Show Hidden Bullish
- Show Hidden Bearish
- Wait 1 Bar
These settings allow traders to determine which divergence observations are relevant to their analytical workflow.
Signal Filtering and Structural Analysis
For traders who want additional structural validation, relevant Pro features include:
- Enhanced Mode
- Divergence Bar Range
- Divergence Lookback
- Filter Length
These features are designed to influence confirmation quality, signal frequency, structural validation, and historical swing selection. They function as quality-control mechanisms rather than independent trading systems.
Visualization Controls
Chart presentation can also be customized using features such as:
- Show Char
- Show Line
- Only Show Last Signal Within Bars
- Price Line Brush
- Price Line Width
- Price Line Dash Style
- Signal Colors
Visualization settings affect presentation and chart organization rather than changing the underlying analytical calculation.
Alerts
The Pro indicator also provides alert-related settings, including:
- Enable Alert
- Alert Sound
These features communicate confirmed signals without changing the signal-generation process itself.
[Get Started With Double Divergence Pro for ProRealTime]
Looking for the complete mathematical breakdown, step-by-step optimization guides, and advanced trading strategies? Explore our comprehensive documentation:
Visit the Technical Inputs Manual: Double Divergence Pro for full parameter tuning.
Read the master guide on the Double Divergence Indicator Series.
Practical Applications of ADX Double Divergence
Trend-Following Analysis
ADX Double Divergence can help traders evaluate whether an established directional move continues to demonstrate underlying trend strength.
Rather than assuming that price continuation automatically means trend strength is unchanged, traders can compare price behavior with ADX behavior.
Breakout Analysis
Breakouts can produce significant directional movement, but not every breakout develops into a sustained trend.
ADX Double Divergence can provide additional information when evaluating whether trend strength supports the developing move.
Trend Quality Assessment
One of the central applications of ADX Double Divergence is evaluating trend quality.
A trend can remain intact while simultaneously showing signs of weakening strength. Recognizing this distinction can provide a more nuanced interpretation of market structure.
Pullback and Continuation Analysis
Hidden Double Divergence can be particularly useful when evaluating established trends after temporary corrections.
Instead of automatically treating every pullback as a reversal, traders can examine whether the broader trend continues to receive underlying support.
ADX Double Divergence is especially suited to strong trending markets, breakout environments, sustained directional movement, and medium- to long-duration trends.
Who Is ADX Double Divergence Pro for ProRealTime Designed For?
The indicator may be particularly relevant to:
- Trend-following traders
- Position traders
- Swing traders analyzing established trends
- Breakout traders
- Futures traders
- Forex traders
- Technical analysts seeking additional trend confirmation
ADX is fundamentally a trend-strength measurement rather than a directional indicator, so ADX Double Divergence should be combined with price action or directional analysis when determining the broader market context.
ADX Double Divergence vs. Traditional ADX Analysis
Traditional ADX analysis focuses primarily on the strength of the prevailing trend.
Double Divergence adds another analytical dimension by comparing how price is behaving with how trend strength is behaving.
This can help traders distinguish between:
Price continuing + trend strength confirming
and
Price continuing + trend strength failing to confirm
That distinction can be valuable because a continuing trend does not necessarily mean an unchanged trend.
The goal is not to replace traditional ADX analysis. Instead, Double Divergence provides an additional framework for interpreting the relationship between price and trend strength.
Important Limitations
ADX Double Divergence should be understood within its intended analytical role.
ADX:
- Measures trend strength rather than direction.
- Can be less informative in sideways markets.
- Should be combined with price action or directional analysis.
- Does not guarantee that a divergence will produce a reversal or continuation.
More broadly, divergence is information rather than prediction. Market context remains essential, and no technical tool should replace sound risk management or broader market analysis.
Frequently Asked Questions
What is ADX Double Divergence?
ADX Double Divergence compares price behavior with ADX behavior to identify situations where trend strength may no longer fully support the current price movement.
Does ADX Double Divergence predict reversals?
No. Divergence represents analytical evidence rather than a guaranteed prediction. A divergence may indicate changing trend conditions, but additional confirmation and market context remain important.
What is the difference between Regular and Hidden Double Divergence?
Regular Divergence is generally associated with potential changes in existing market behavior, such as weakening trend quality. Hidden Divergence is commonly associated with pullbacks and potential continuation of an established trend.
Why does ProRealTime require two indicators?
Due to a ProRealTime display limitation, the PatternSmart implementation uses two separate indicator instances—one on the main chart and one in the subchart—to display the required lines and signal characters correctly.
Does using two indicators change the Double Divergence methodology?
No. The two-indicator arrangement is a platform-specific implementation requirement. The underlying Double Divergence methodology remains the same.
Can I customize which divergence signals are displayed?
Yes. The Double Divergence Pro feature set includes separate controls for Regular Bullish, Regular Bearish, Hidden Bullish, and Hidden Bearish signals.
Can the signals be filtered?
Yes. Pro features such as Enhanced Mode, Divergence Bar Range, Divergence Lookback, and Filter Length provide additional structural and confirmation controls.
Is ADX Double Divergence suitable for Forex and futures?
The indicator’s analytical profile is particularly suited to trend-following, position, swing, and breakout analysis, and the Foundation Documents specifically identify Forex and futures traders among its ideal users.
Analyze Trend Strength from a Different Perspective
A market trend is more than a sequence of higher highs or lower lows. Understanding whether the underlying trend remains strong, weakens while price continues, or maintains support during a pullback can add important context to technical analysis.
ADX Double Divergence Pro for ProRealTime provides a structured way to examine that relationship.
By combining ADX trend-strength analysis with Regular and Hidden Double Divergence, the indicator helps traders investigate trend quality, directional conviction, continuation, and changing market conditions within the visual ProRealTime environment.
The methodology does not attempt to predict the future. Instead, it provides another source of evidence that can be considered alongside price action, market structure, and confirmation.
For ProRealTime users who want to incorporate structured Double Divergence analysis into a professional chart-analysis workflow, ADX Double Divergence Pro provides a platform-specific implementation designed around the same PatternSmart analytical principles used throughout the Double Divergence product family.