Advanced CCI Divergence Analysis for Market Extremes and Mean Reversion
Price can continue moving in one direction even after the underlying market condition begins to change.
This is particularly important when a market becomes extended. A new price high or low may appear to confirm the existing move, yet the underlying behavior measured by an indicator may no longer provide the same degree of confirmation.
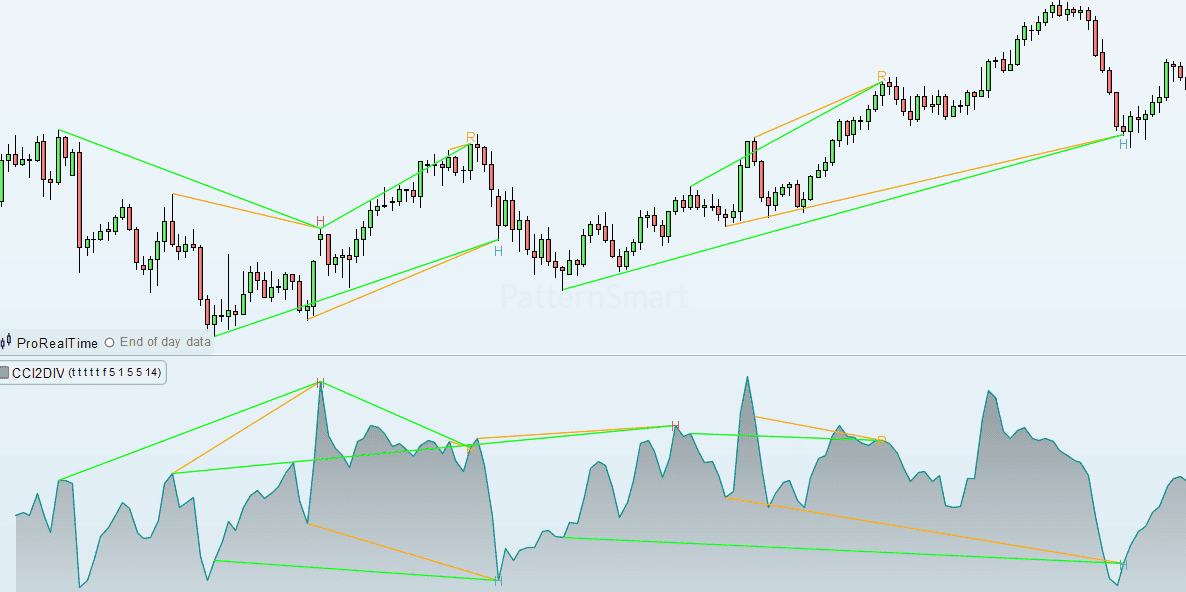
CCI Double Divergence Pro for ProRealTime provides a structured way to examine this relationship by combining the Commodity Channel Index (CCI) with PatternSmart’s Double Divergence methodology.
CCI focuses on price deviation from its statistical average, making it particularly useful when evaluating extended price movement, market extremes, cyclical behavior, and potential mean-reversion conditions. Double Divergence adds another layer of analysis by comparing CCI behavior with actual price structure.
Designed for ProRealTime, the indicator integrates this analysis into a visually focused professional charting workflow.
What Is CCI Double Divergence?
The Commodity Channel Index, commonly known as CCI, evaluates how far price has moved away from its statistical average.
This makes CCI useful for studying situations where price becomes relatively extended.
However, simply observing an elevated or depressed CCI reading does not tell the complete story.
The more important question can be:
Is price continuing to move farther in the same direction while CCI is no longer confirming that movement?
This is where Double Divergence becomes useful.
CCI Double Divergence compares price behavior with CCI behavior to identify situations where extended price movement may no longer be receiving the same underlying support.
The resulting divergence can provide additional information for evaluating:
- Market extremes
- Price deviation
- Momentum normalization
- Cyclical movement
- Potential mean reversion
- Possible changes in market behavior
The signal should be treated as analytical information rather than a guaranteed reversal prediction.
Why CCI Is Different from Other Double Divergence Indicators
Each Double Divergence indicator provides a different analytical perspective.
ADX focuses on trend strength. RSI focuses on momentum. Money Flow examines buying and selling pressure. CCI focuses on price deviation from statistical averages.
Consequently, the same price structure can produce different divergence characteristics depending on the indicator being analyzed. This is an intentional part of the PatternSmart methodology.
CCI is particularly relevant when the analytical question involves how extended price has become relative to its statistical behavior.
This makes CCI Double Divergence especially suitable for analyzing market extremes and cyclical conditions.
Understanding the Four Double Divergence Signals
PatternSmart uses four official divergence classifications:
- Bullish Regular Divergence
- Bearish Regular Divergence
- Bullish Hidden Divergence
- Bearish Hidden Divergence
The classification remains consistent across PatternSmart’s supported platforms, including ProRealTime. Only the software implementation changes.
Bullish Regular Divergence
Bullish Regular Divergence occurs when price establishes a lower low while the underlying indicator does not confirm the same downward movement.
With CCI, this may indicate that the downward price movement is becoming less strongly supported by the indicator’s measurement of price deviation.
In an extended decline, this can provide information for evaluating whether the market is approaching a condition where downward pressure may be changing.
It does not mean that price must immediately reverse.
Additional confirmation from price action and market structure remains important.
Bearish Regular Divergence
Bearish Regular Divergence occurs when price establishes a higher high while CCI fails to confirm the same degree of upward price movement.
This can become particularly relevant when price has already experienced an extended advance.
The divergence may indicate that the market’s current price extension is no longer being confirmed in the same way by CCI.
Rather than automatically interpreting this as a short signal, traders can use the observation to investigate whether the market is entering a potential normalization or mean-reversion phase.
Bullish Hidden Divergence
Bullish Hidden Divergence is associated with continuation analysis during a broader bullish structure.
When a temporary pullback occurs, Hidden Divergence can provide another perspective on whether the broader market condition may remain intact.
For CCI, this creates an opportunity to evaluate the relationship between a price pullback and CCI’s corresponding behavior.
Bearish Hidden Divergence
Bearish Hidden Divergence provides the corresponding perspective during a broader bearish structure.
A temporary upward correction may occur while the larger bearish structure remains intact.
CCI Double Divergence can help traders evaluate whether the indicator behavior remains consistent with the broader bearish market condition.
The key principle is that Regular and Hidden Divergence serve different analytical purposes. Classification organizes the observation; market context and confirmation determine how it should be interpreted.
CCI Double Divergence for Market Extremes
One of CCI’s distinctive analytical characteristics is its ability to highlight price deviation and statistically extended market conditions.
CCI divergence frequently develops when price reaches an extended condition while the indicator begins normalizing.
This can make CCI Double Divergence particularly useful when analyzing:
- Extended rallies
- Extended declines
- Cyclical price movement
- Potential exhaustion
- Mean-reversion environments
- Market extremes
The objective is not to predict exactly when an extreme will reverse.
Instead, the divergence provides another piece of evidence that can help traders evaluate whether the current price movement continues to receive the same underlying support.
When Is CCI Double Divergence Most Relevant?
The CCI indicator profile identifies several market environments where this type of analysis can be particularly useful:
Range-Bound Markets
In range-bound markets, price frequently moves between areas of relative extension.
CCI Double Divergence can provide additional information when price approaches one side of a range and begins showing divergence with CCI.
Cyclical Markets
Markets that repeatedly move through identifiable cycles can provide useful conditions for studying CCI divergence.
The relationship between price extremes and CCI behavior can help traders examine whether the current cycle is maintaining its previous characteristics.
Extended Price Movement
CCI Double Divergence is particularly relevant when price has experienced a prolonged or extended movement.
When price continues establishing new extremes but CCI does not confirm the same behavior, traders may want to examine whether the market is approaching a normalization phase.
These applications are consistent with CCI’s documented analytical profile.
Built for ProRealTime
ProRealTime is a professional charting and trading platform known for high-quality chart visualization, integrated analysis, clean visual presentation, and a professional analytical workflow.
Its environment is particularly suited to traders who prioritize chart interpretation and technical decision-making.
ProRealTime supports analysis across markets including:
- Stocks
- Futures
- Forex
- CFDs
- Indices
The platform’s chart-focused environment provides a natural setting for studying price structure and divergence relationships visually.
CCI Double Divergence Pro is designed to complement this workflow by providing structured divergence analysis without changing the underlying PatternSmart methodology.
Important ProRealTime Requirement: Two Separate Indicators
Why Two Indicator Instances Are Required
Due to a limitation of ProRealTime, CCI Double Divergence Pro for ProRealTime must be installed and used as two separate indicator instances.
One instance is placed on the main chart, while the other is placed in the subchart.
This arrangement is necessary to properly display the required lines and characters (chars) within the ProRealTime chart environment.
Main Chart Indicator
The main-chart instance is responsible for displaying the divergence-related visual elements that need to appear directly with price.
This makes it easier to visually connect the identified divergence structure with the corresponding price highs, lows, and market movement.
Subchart Indicator
The second instance is placed in a subchart to display the CCI-related information and supporting visual elements in their appropriate analytical area.
Using both instances together provides the intended complete visual presentation.
Does This Change the Methodology?
No.
The requirement to use two separate indicators is a ProRealTime implementation limitation, not a change to the PatternSmart Double Divergence methodology.
The classification, terminology, and interpretation principles remain consistent across supported platforms. Only the software implementation differs.
For ProRealTime users, the two-indicator arrangement should therefore be viewed as part of the platform-specific setup required to display the complete CCI Double Divergence analysis.
Double Divergence Pro Features
CCI Double Divergence Pro includes controls covering signal generation, confirmation, structural filtering, visualization, and alerts.
Select the Divergence Types You Want to Analyze
The Pro input system includes individual controls for:
- Show Regular Bullish
- Show Regular Bearish
- Show Hidden Bullish
- Show Hidden Bearish
This allows the chart to focus on the divergence classifications that are relevant to the trader’s analytical objective.
Wait 1 Bar
Wait 1 Bar is a signal-generation feature associated with confirmation timing and signal stability.
It can be used as part of a more confirmation-oriented workflow rather than simply prioritizing the earliest possible observation.
This is consistent with the broader PatternSmart philosophy that more signals do not necessarily produce better analysis.
Enhanced Mode
Enhanced Mode provides an additional signal-filtering option.
Its documented focus includes:
- Structural validation
- Signal quality
- Noise reduction
- Confirmation refinement
- Filtering workflow
This makes it relevant when the goal is to refine the analytical conditions used to validate divergence observations.
Divergence Bar Range
Divergence Bar Range provides an advanced structural parameter associated with:
- Structural search boundaries
- Historical swing selection
- Divergence distance
- Structure evaluation
It helps define the structural area used when evaluating divergence relationships.
Divergence Lookback
Divergence Lookback is associated with swing identification, historical evaluation, structural analysis, and sensitivity.
This gives experienced users another way to refine how historical price structures are considered during divergence analysis.
Filter Length
Filter Length addresses internal smoothing, structural consistency, signal sensitivity, and parameter interaction.
It works within the broader structural-analysis framework rather than functioning as an independent trading strategy.
Visual Display Controls
CCI Double Divergence Pro also includes visualization controls such as:
- Show Char
- Show Line
- Only Show Last Signal Within Bars
- Price Line Brush
- Price Line Dash Style
- Price Line Width
These settings are designed to control how confirmed signals and divergence structures are presented on the chart.
This is especially relevant for ProRealTime users because the product’s two-indicator arrangement makes clear visual organization an important part of the workflow.
Alerts
The Pro input system includes:
- Enable Alert
- Alert Sound
Alerts operate after a confirmed signal and do not change the underlying signal-generation process.
[Get Started With Double Divergence Pro for ProRealTime]
Looking for the complete mathematical breakdown, step-by-step optimization guides, and advanced trading strategies? Explore our comprehensive documentation:
Visit the Technical Inputs Manual: Double Divergence Pro for full parameter tuning.
Read the master guide on the Double Divergence Indicator Series.
Practical Benefits of CCI Double Divergence Pro
Evaluate Extended Price Movement
Instead of examining price extremes alone, traders can compare them with CCI behavior.
This provides another perspective when evaluating whether an extended move continues to receive underlying confirmation.
Study Potential Mean-Reversion Conditions
CCI’s focus on price deviation makes it particularly relevant to mean-reversion analysis.
Double Divergence adds a structural comparison between price and indicator behavior.
Analyze Cyclical Market Behavior
For markets that exhibit recurring price cycles, CCI Double Divergence can help organize observations around market extremes and changing indicator behavior.
Add Confirmation to Price Analysis
Price action remains the primary source of market information.
CCI Double Divergence provides additional analytical confirmation rather than replacing direct price analysis.
CCI Double Divergence: Strengths and Limitations
CCI Double Divergence offers several useful analytical characteristics:
- Strong focus on market extremes
- Useful for evaluating price deviation
- Supports mean-reversion analysis
- Applicable across multiple asset classes
- Useful for cyclical market analysis
However, CCI Double Divergence also has limitations.
It can be less effective during powerful trends, and divergence should be evaluated together with broader market context and confirmation.
This is important because an apparently extended market can remain extended longer than expected.
A divergence therefore should not be treated as proof that a reversal is imminent.
A Confirmation-First Approach to CCI Divergence
The PatternSmart Double Divergence methodology follows a structured analytical process:
- Identify the divergence category
- Identify the underlying indicator
- Understand what the indicator measures
- Evaluate the current market context
- Seek additional confirmation
- Form an analytical interpretation
- Make an independent trading decision using the complete technical evidence
This approach is designed to support disciplined analysis rather than prediction.
For CCI, this means remembering that the indicator’s unique contribution is its perspective on price deviation and statistical extremes.
Frequently Asked Questions
What is CCI Double Divergence?
CCI Double Divergence compares price behavior with CCI behavior to identify situations where price movement may no longer be receiving the same underlying support from the indicator’s measurement of price deviation.
What does CCI measure?
CCI measures how far price has moved away from its statistical average. This makes it particularly useful for evaluating price deviation, market extremes, and cyclical behavior.
What is CCI Double Divergence used for?
It can be used to study market extremes, extended price movement, cyclical behavior, potential mean-reversion conditions, and changes in the relationship between price and CCI.
What is the difference between Regular and Hidden Double Divergence?
Regular Divergence generally provides information about potential changes in an existing price movement, while Hidden Divergence is primarily used in the context of continuation analysis following a pullback.
The interpretation always depends on the underlying indicator and broader market context.
Why do I need two CCI Double Divergence indicators in ProRealTime?
Due to a ProRealTime platform limitation, two separate indicator instances are required: one on the main chart and one in the subchart. This allows the product to display the required lines and characters correctly.
Does using two indicators affect the signals?
No. The two-indicator setup is a platform-specific display implementation. The underlying Double Divergence classification and methodology remain unchanged.
Can I show only specific divergence types?
Yes. The Pro input system provides separate controls for Regular Bullish, Regular Bearish, Hidden Bullish, and Hidden Bearish divergence.
Can I reduce the number of displayed historical signals?
Yes. Only Show Last Signal Within Bars is a display and chart-organization feature designed to manage historical signal presentation and improve visual clarity.
Is CCI Double Divergence a guaranteed reversal indicator?
No. Divergence provides information, not prediction. CCI Double Divergence should be combined with price action, market structure, and other relevant technical evidence. The PatternSmart methodology explicitly emphasizes confirmation and acknowledges that no technical tool can eliminate market uncertainty.
Analyze Market Extremes with Greater Context
CCI provides a distinct analytical perspective by focusing on price deviation, statistical extremes, cyclical movement, and mean reversion.
When combined with Double Divergence, this perspective becomes a structured way to compare price behavior with CCI behavior rather than examining either one independently.
CCI Double Divergence Pro for ProRealTime brings this methodology into a visually focused ProRealTime workflow, with configurable signal, filtering, structural, visualization, and alert features.
The ProRealTime version requires two separate indicator instances—one on the main chart and one in the subchart—because of a platform limitation affecting the display of the required lines and characters. This implementation detail does not change the underlying PatternSmart Double Divergence methodology.
For traders studying extended price movement, cyclical markets, and potential mean-reversion conditions, CCI Double Divergence provides another structured source of technical evidence—one that can be evaluated alongside price action and broader market context.
Explore CCI Double Divergence Pro for ProRealTime
Integrate structured CCI Double Divergence analysis into your ProRealTime chart workflow and examine price deviation and market extremes from a confirmation-oriented perspective.