The Downside Gap Three Methods is a rare, three-candle bearish continuation pattern that appears during an established downtrend. It signals a temporary pause or profit-taking period before the prevailing bearish momentum resumes.
While the final candle in the structure is bullish and fills a previously created gap, technical analysts view this not as a reversal, but as a failed attempt by buyers to seize control.
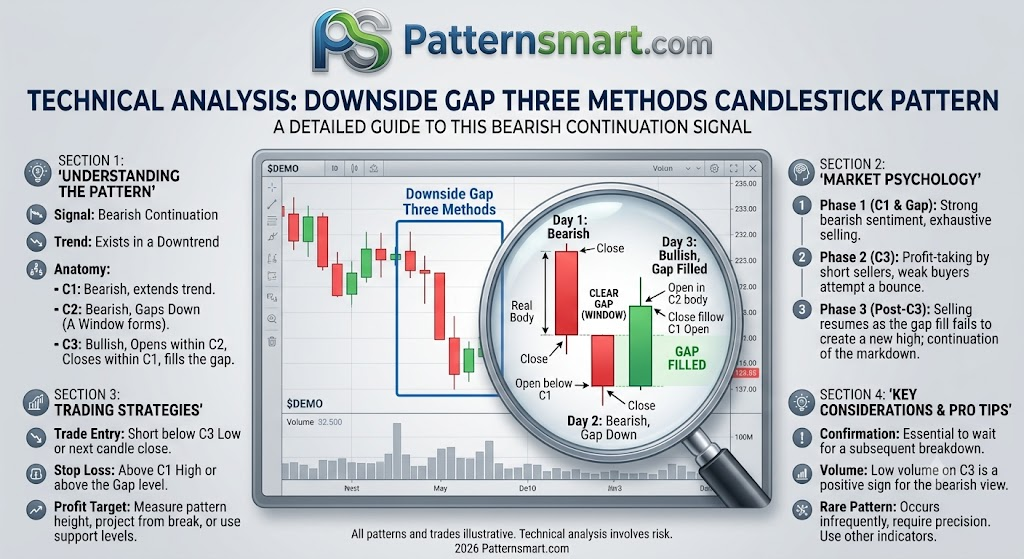
Anatomy of the Pattern
To accurately identify a Downside Gap Three Methods pattern, three specific candles must print in sequence:
- Candle 1 (Bearish): A long, red (or black) candle that prints firmly within an ongoing downtrend, confirming strong selling pressure.
- Candle 2 (Bearish): Another red candle that gaps down below the close of the first candle. The bodies of Candle 1 and Candle 2 should not overlap, leaving a clear window of empty space on the chart.
- Candle 3 (Bullish): A green (or white) candle that opens within the real body of Candle 2 and rallies upward, closing inside the real body of Candle 1. This move effectively closes or fills the gap created between the first two days.
Market Psychology Behind the Movement
Understanding the underlying order flow explains why this pattern acts as a continuation mechanism:
- Dominance: On the first day, sellers are completely in control, pushing prices lower.
- Exhaustion Gap: The second day begins with a sharp gap down, showing extreme bearish sentiment. However, after pushing lower, the market becomes locally oversold.
- The Trap: On the third day, short-sellers begin locking in profits and buyers step in, driving a sharp counter-trend rally. This rally manages to fill the gap.
- Resumption: Crucially, even though the third candle is strong, it fails to break above the open of the first candle. Bears recognize this weak bounce as an opportunity to short the asset at a better price, leading to a continuation of the sell-off.
Trading Strategies and Execution
Trading this pattern requires patience, as execution should only occur after the pattern fully forms and a confirmation candle breaks lower.
| Element | Tactical Level | Execution Rules |
| Trade Entry | Short Entry | Enter short immediately below the low of Candle 3, or wait for the next candle to close below Candle 3’s body to confirm the breakdown. |
| Stop Loss | Risk Management | Place the stop loss slightly above the high of Candle 1 or the top of the filled gap to protect against a true reversal. |
| Profit Target | Take Profit | Project the height of the pattern downward from the entry point, or use key support lines and structural swing lows as targets. |
Pro Tip: Because this pattern is rare, it is highly recommended to pair it with momentum oscillators like the Relative Strength Index (RSI) or volume indicators. A sharp decrease in volume on the third (green) day confirms that the bounce lacks institutional buying pressure, increasing the probability of a successful short trade.
Please check our Bearish and Bullish Patterns Indicator collection.