While intense market crashes and steep downward gaps can panic retail investors, institutional traders view them as a clear map of market momentum. When an asset gaps lower, it reveals an aggressive imbalance where supply completely overwhelms demand. However, markets rarely move in a straight line, and brief counter-trend pauses often fool amateur traders into buying a false bottom.
The Downside Tasuki Gap is a highly reliable, three-candle bearish continuation pattern. It captures a specific market cycle: a forceful gap down, a weak and deceptive bullish retracement, and an ultimate failure that signals the immediate resumption of the macro downtrend. For short-sellers, this structure offers a textbook entry point to add to or initiate positions at a structural premium.
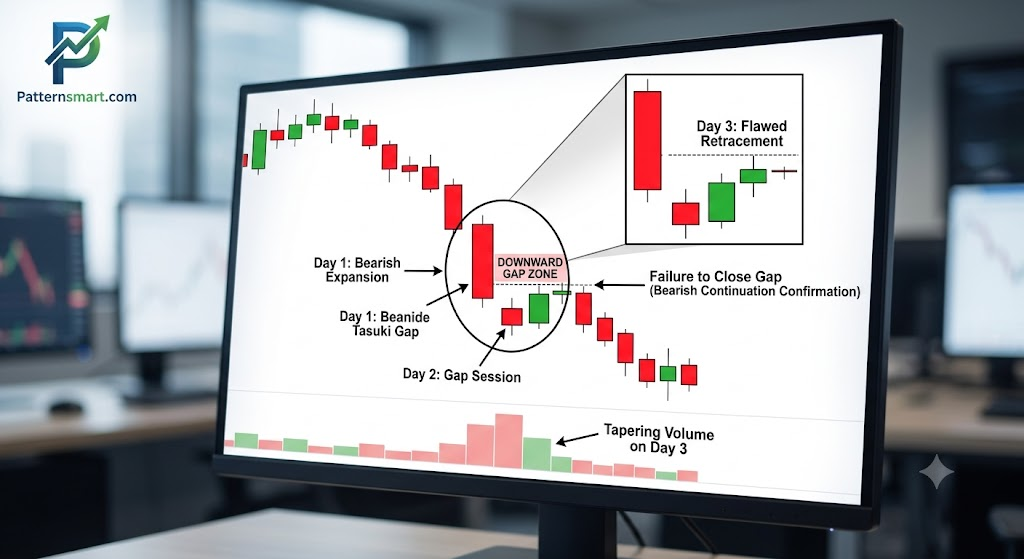
Anatomy of the Downside Tasuki Gap
To separate an authentic Downside Tasuki Gap from a potential bullish reversal structure (like a Piercing Line or Morning Star), the price action must meet rigid structural requirements:
- Trend Context: The market must be locked into an established, well-defined downtrend.
- Candle 1 (Bearish Expansion): A long, dominant bearish (red or black) candle that reinforces the ongoing downward momentum.
- Candle 2 (The Gap Session): Another bearish candle that opens by gapping down below the low of Candle 1, closing even lower. This creates a distinct, unfilled window of open space on the chart between the real bodies of Candle 1 and Candle 2.
- Candle 3 (The Flawed Retracement): A bullish (green or white) candle that opens within the real body of Candle 2 and rallies upward. Crucially, Candle 3 must close inside the open gap zone but fail to completely close the gap created between Candle 1 and Candle 2. Its closing price must remain below the real body of Candle 1.
Downside Tasuki Gap vs. Upside Tasuki Gap
While sharing a similar structural mechanic, these twin patterns indicate entirely opposite market trajectories:
| Feature | Downside Tasuki Gap | Upside Tasuki Gap |
| Preceding Trend | Strong Downtrend | Strong Uptrend |
| The Gap | Gaps downward between Candle 1 & 2. | Gaps upward between Candle 1 & 2. |
| Candle 3 Mission | Rallies up but fails to close the lower gap. | Drops down but fails to close the upper gap. |
| Market Outcome | Bearish Continuation | Bullish Continuation |
Market Psychology: The Failure of the Dip-Buyers
Understanding the internal friction between buyers and sellers during this three-day arc explains why the pattern carries such strong continuation probabilities:
- The Bears Strike (Day 1): Continuous selling pressure creates a solid red candle, confirming that sellers possess complete control over the immediate market structure.
- The Panic Gap (Day 2): An influx of sell orders or negative overnight sentiment causes the asset to gap down significantly at the opening bell. Sellers continue driving the price lower intraday, cementing a profound sense of bearish urgency.
- The Illusory Bounce (Day 3): Seeing the asset heavily extended, shorter-term profit-takers cover their shorts, and aggressive counter-trend retail traders step in to “buy the dip.” This causes the price to rally into a green candle. However, this rally is fundamentally weak. The bulls manage to push the price into the gap zone but lack the structural capital to close the window or penetrate yesterday’s supply block (Candle 1).
- The Trap Snaps: Because the bulls failed to close the gap, the open window now transforms into a firm level of overhead structural resistance. Long traders realize they are trapped, and institutional shorts re-enter the market to drive the price back down.
How to Trade the Downside Tasuki Gap
Because continuation patterns trade in complete alignment with the dominant macro trend, they generally offer highly favorable risk-to-reward ratios.
1. Execution Triggers
- The Immediate Entry: Enter a short position near the closing bell of Candle 3, once it becomes mathematically clear that the buyers have failed to close the gap between Candle 1 and Candle 2.
- The Confirmation Entry: Place a sell-stop order just below the lowest point of Candle 2. When the market breaks this level on the following session, it confirms that the Day 3 bounce has completely rolled over.
2. Risk Management Parameters
- Stop-Loss Placement: Place your technical stop-loss just above the real body of Candle 1. If the market rallies forcefully enough to invalidate the origin of the initial breakdown, the bearish continuity thesis is broken. (For a tighter, more aggressive stop-loss, you can place it just above the high of Candle 3).
- Take-Profit Targets: Target major structural support levels, historical demand zones, or project a measured move equal to the distance of the initial downward leg prior to the gap.
Volume Confluence Hint: A textbook Downside Tasuki Gap will show a noticeable decrease in volume on Candle 3. Anemic volume on the green retracement candle proves that institutions are not backing the rally; it is merely a low-liquidity bounce driven by retail traders. A subsequent surge in volume on the following sessions completely confirms the pattern’s continuation bias.
Please check our Bearish and Bullish Patterns Indicator collection.