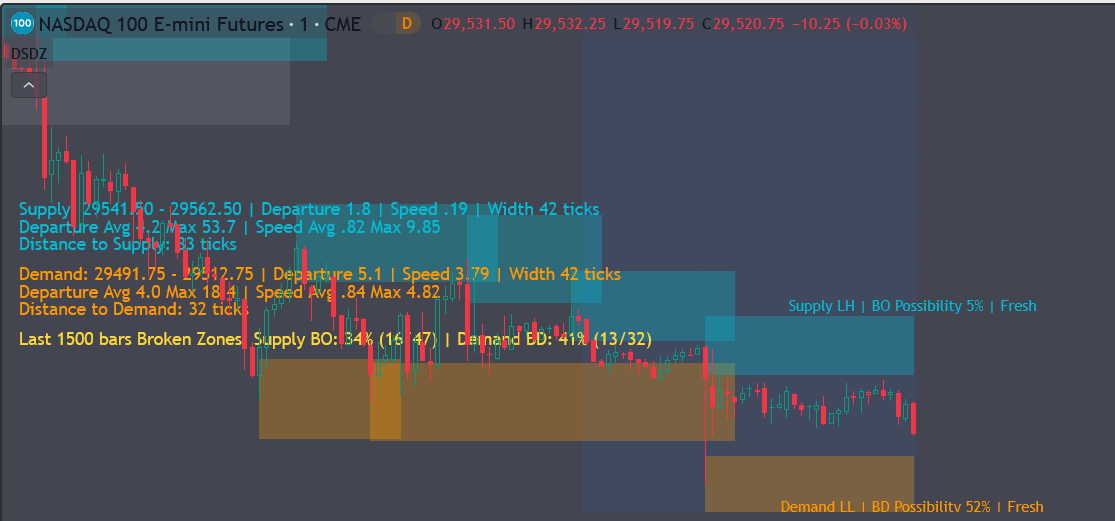
The Dynamic Supply & Demand Zone (DSDZ) real-time dashboard serves as your institutional telemetry system. Instead of forcing you to manually guess the strength of a liquidity zone, it quantifies institutional aggression, historical zone reliability, and real-time market proximity directly on your chart.
Here is a comprehensive breakdown of what each value on the dashboard signifies and how you can utilize this information to sharpen your execution.
1. Dashboard Metrics: What You See & What It Solves
The dashboard is divided into structural segments monitoring key liquidity ceilings (Supply), floors (Demand), and historical validation metrics.
Institutional Imbalance & Velocity Telemetry
-
Zone Price Boundaries: Displays the exact structural floor and ceiling of the active institutional blocks.
-
What it solves: Eliminates guesswork by providing precise price levels where major order blocks are concentrated.
-
-
Imbalance Magnitude (Departure): Quantifies how far price expanded away from the zone immediately after its creation, adjusted for recent market volatility.
-
What it solves: Determines the severity of the initial supply/demand mismatch. A massive departure indicates heavy institutional capitalization.
-
-
Imbalance Velocity (Speed): Measures the rate of acceleration as price vacated the zone.
-
What it solves: Differentiates between a casual market drift and aggressive, algorithmic institutional clearing. High velocity means institutions wanted to fill orders and move price away rapidly.
-
-
Zone Structural Thickness (Width): The vertical depth of the zone measured in price increments (ticks). This thickness automatically expands or contracts based on underlying market volatility.
-
What it solves: Prevents you from using static, rigid zones in highly volatile or completely dead markets.
-
Comparative Historical Benchmarks
-
Historical Departure Norms (Avg / Max): Shows the average and peak expansion metrics of all previous structural zones on the chart.
-
What it solves: Contextualizes the current zone. It allows you to immediately see if the current zone’s institutional footprint is stronger or weaker than the historical baseline.
-
-
Historical Velocity Baselines (Avg / Max): Tracks the historical average and maximum exit speeds of past zones.
-
What it solves: Helps you judge if the current market expansion exhibits extraordinary institutional momentum or just standard market noise.
-
Real-Time Proximity & Trailing Validation
-
Proximity to Key Liquidity: Measures the exact distance from the current market price to the edge of the nearest zone, explicitly stating if price is currently mitigating inside the block or has breached it.
-
What it solves: Enhances situational awareness, preventing you from chasing trades right before price hits a major counter-trend liquidity pocket.
-
-
Historical Breakthrough Efficiency (Validation Stats): Tracks a trailing window of historical zones that have been completely breached, displaying a percentage-based success rate of how frequently these structural breaks occurred.
-
What it solves: Quantifies market environment bias. In a strongly trending market, breakthrough statistics will skew higher, signaling that trading breakouts or continuations carries historical statistical backing.
-
2. Practical Application: How to Utilize the Dashboard Information
+-----------------------------------------------------------------------------+
|                                 DSDZ DASHBOARD                              |
|  Supply Zone Telemetry   ---> Compare Current vs. Historical Benchmarks     |
|  Demand Zone Telemetry   ---> Check Velocity, Magnitude, & Structural Depth |
|  Trailing Validation     ---> Read Market Regime (Trending vs. Mean Reverting)|
+-----------------------------------------------------------------------------+
Contextualizing Zone Quality (The Institutional Footprint)
Before taking a reversal trade at a freshly tested zone, look at the Imbalance Magnitude and Imbalance Velocity of that specific zone and compare them to the Historical Averages displayed below it.
-
The High-Probability Setup: If the current zone boasts a magnitude and velocity well above historical averages, it indicates a highly aggressive institutional defense. Reversals or retests at this zone carry a higher probability of success.
-
The Low-Probability Setup: If the current zone shows metrics significantly below the historical averages, the institutional commitment there is weak. Expect this zone to be easily breached.
Dynamic Risk Management & Positioning
Use the Zone Structural Thickness and Proximity data to optimize your risk-to-reward ratios before placing an order.
-
When market volatility spikes, the zone thickness automatically adjusts to accommodate wider institutional positioning.
-
If the dashboard shows that the zone thickness is wider than normal, you should dynamically scale down your position size to maintain standard risk parameters, using the outer boundary of the zone as your strict structural invalidation level.
Identifying Market Regimes via Breakthrough Efficiency
The Historical Breakthrough Efficiency percentage at the bottom of the dashboard is your ultimate guide to market regime filtering.
-
High Breakthrough Percentages (e.g., >65%): The market is in an aggressive, one-way trending regime. In this environment, attempting to trade reversals off fresh zones is highly risky. Instead, utilize this data to trade structural breakouts or look for continuations when a zone fails.
-
Low Breakthrough Percentages (e.g., <35%): The market is locked in a choppy, mean-reverting, or range-bound regime. This is the optimal environment to fade the extremes—buying the demand floors and selling the supply ceilings as indicated by the proximity tracker.