The golden ratio is also called the golden mean or golden section.
It has been used to analyze the proportions of natural objects as well as man-made systems such as financial markets.
The mathematics of the golden ratio and of the Fibonacci sequence is intimately interconnected. The Fibonacci sequence is:
1, 1, 2, 3, 5, 8, 13, 21, 34, 55, 89, 144, 233, 377, 610, 987, ….
The golden ratio is the limit of the ratios of successive terms of the Fibonacci sequence (or any Fibonacci-like sequence).
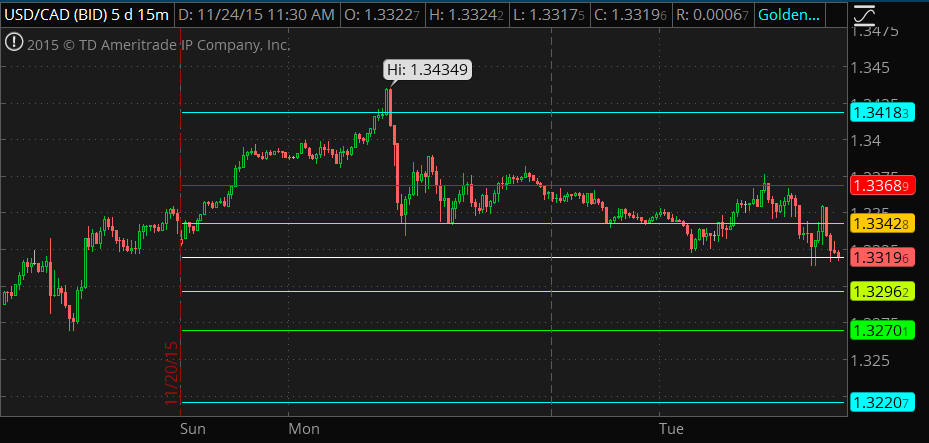
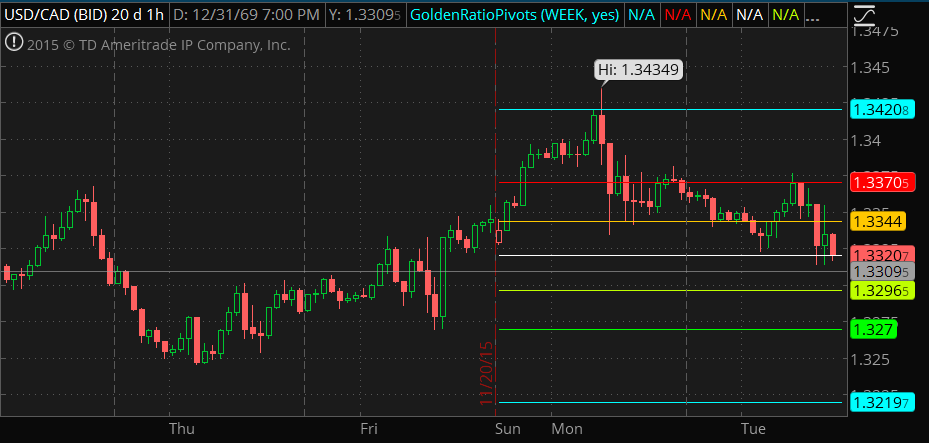
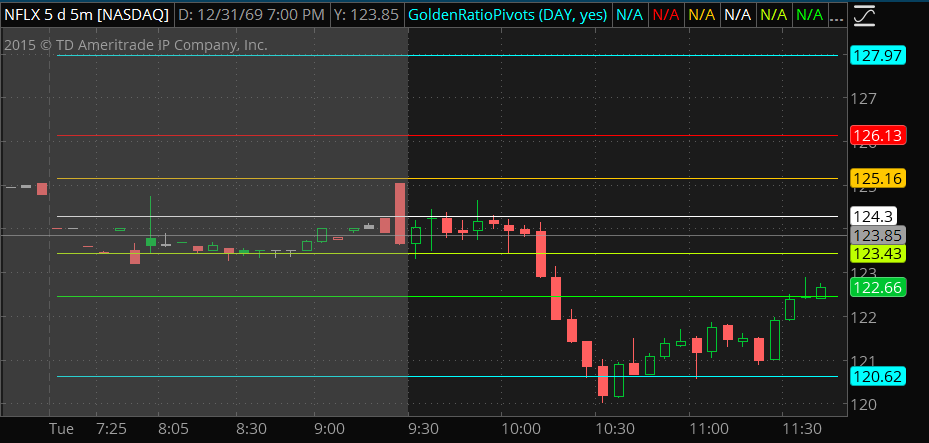
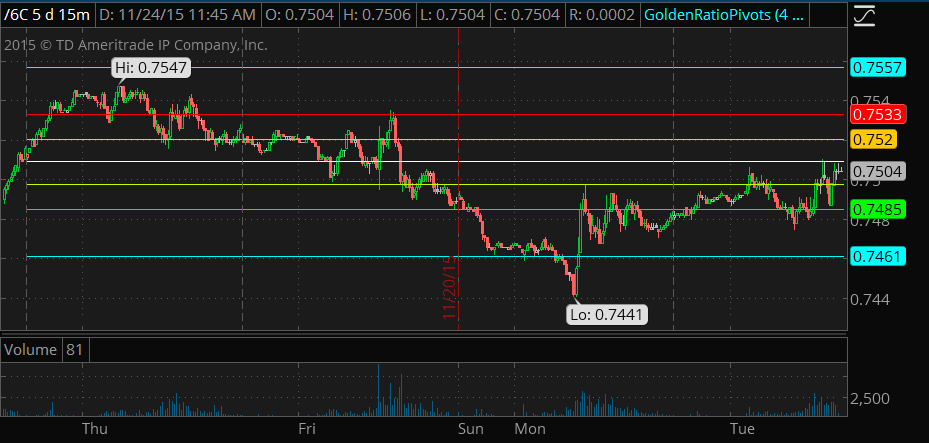
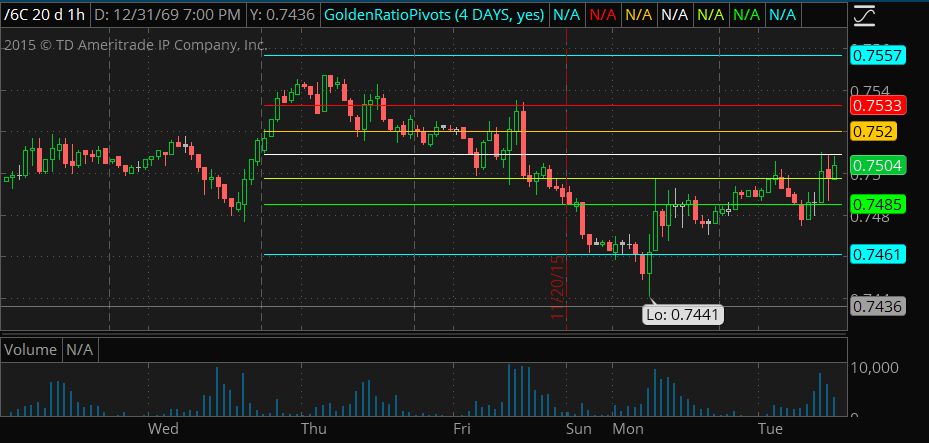
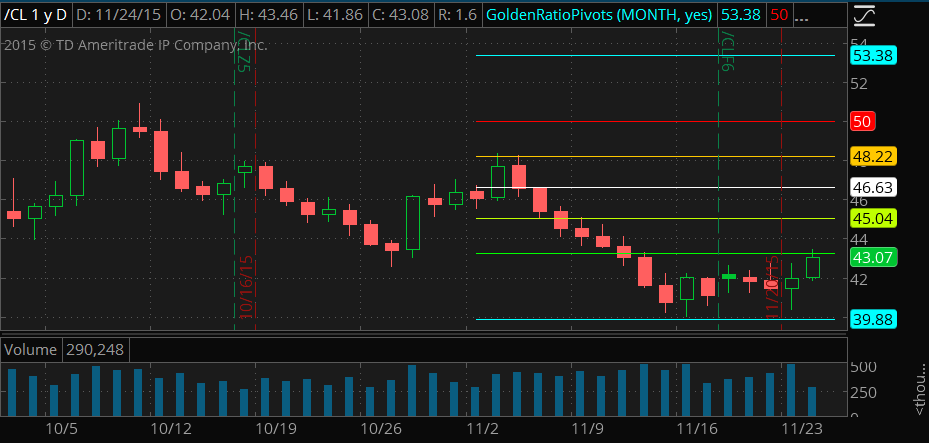
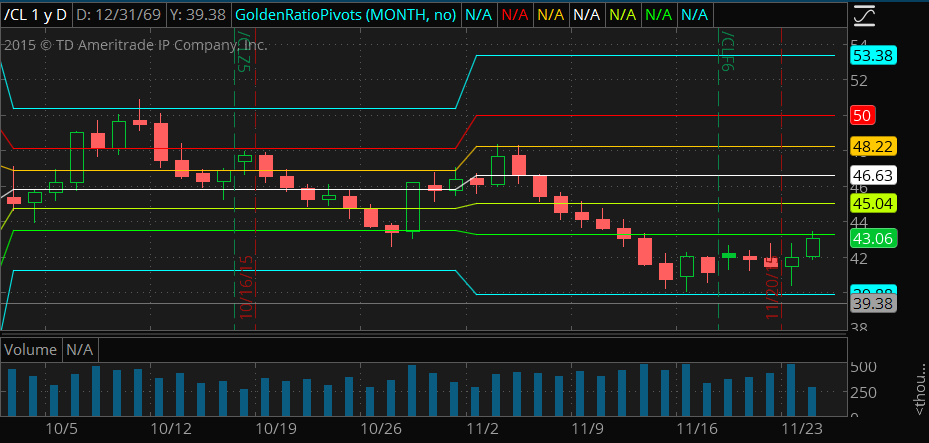
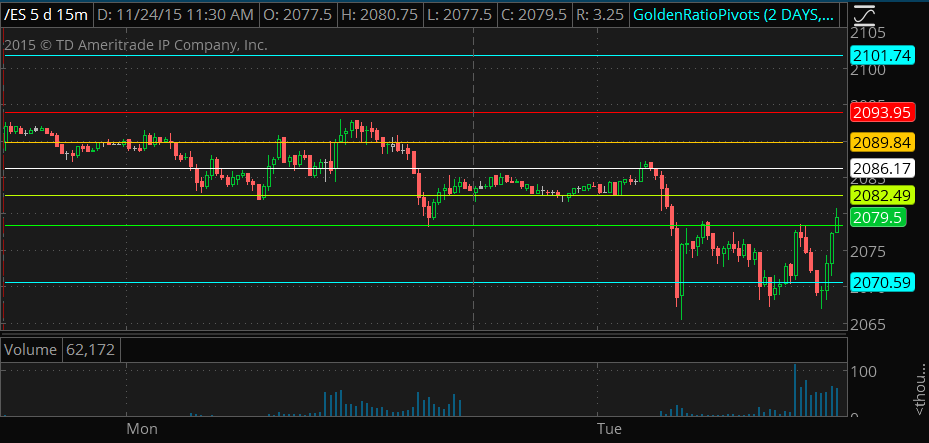
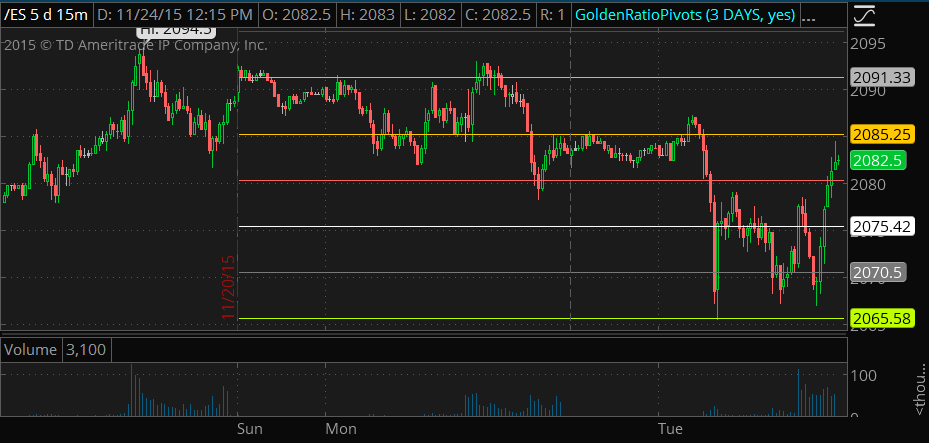
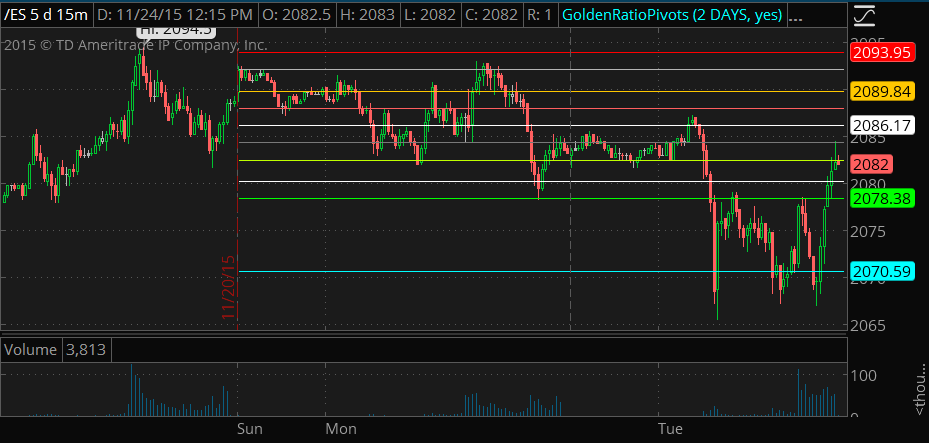
This golden ratio pivot indicator plot 5 support levels and 5 resistance levels based on the golden ratio and a center pivot line.
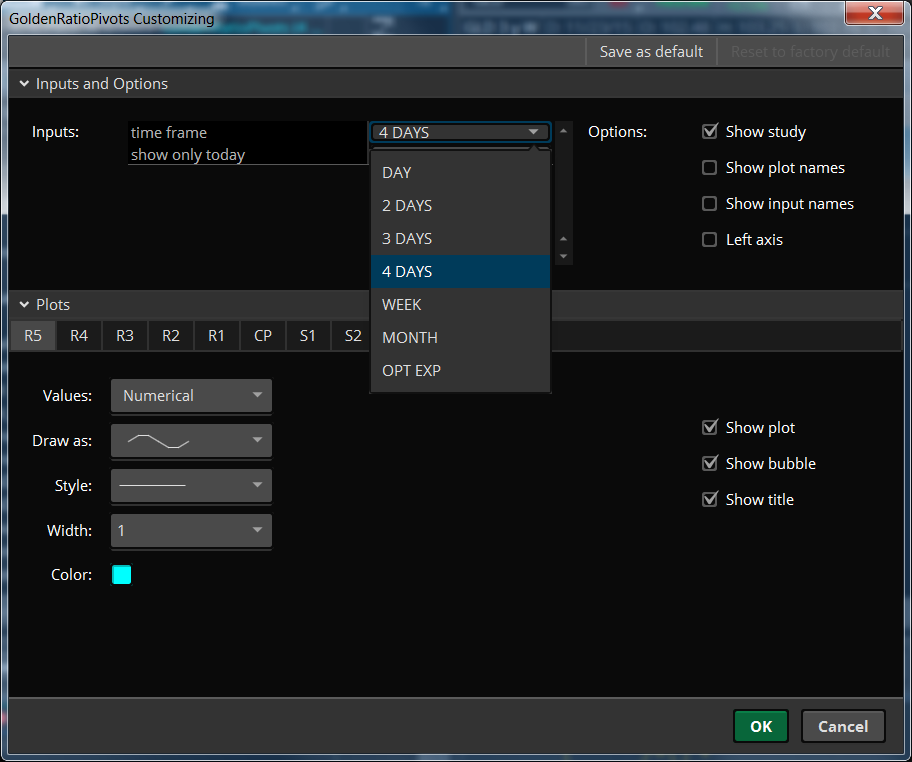
It is very easy to use with no complicated parameters waiting for you.
All you need to do is to load it to your chart.
This indicator works on all time frames.
The levels of support and resistance are formed at the beginning of a new session, and it will never repaint.
The following images show how Golden Ratio Pivot works in same timeframe and same period but with different settings.


Get it here: http://www.patternsmart.com/cart/index.php?route=product/product&path=57_83&product_id=315
If you want to customise this indicator, please contact us.