Analyze Market Extremes with Structured Double Divergence Analysis
Markets can remain overextended longer than expected. A price movement may continue toward a new high or low even as the underlying behavior measured by an oscillator begins to change. Recognizing that difference is one of the central challenges of technical analysis.
Williams %R Double Divergence Pro for MultiCharts provides a structured way to examine these situations by combining Williams %R with the PatternSmart Double Divergence methodology.
Williams %R focuses on relative price positioning within a recent trading range. Double Divergence compares this indicator behavior with price movement, helping traders identify situations where price reaches an extreme while the underlying indicator behavior begins to change.
The objective is not to predict a reversal. Instead, the indicator provides additional analytical evidence that can help traders evaluate market extremes, mean-reversion conditions, and potential changes in market behavior.
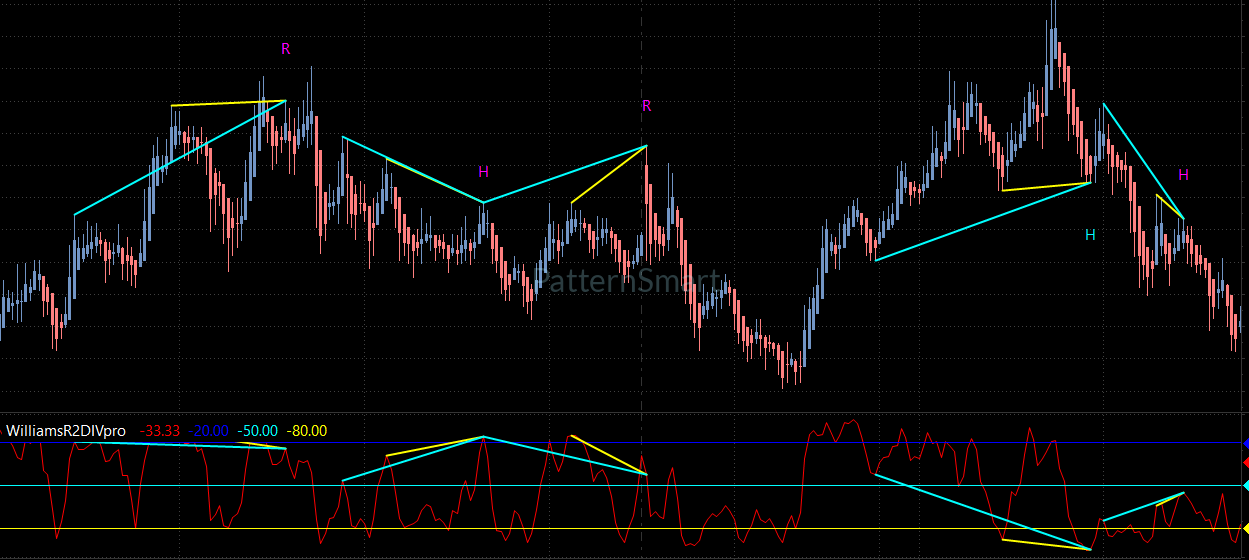
Why Williams %R Is Useful for Market-Extreme Analysis
Williams %R is particularly useful when the analytical question is not simply whether price is rising or falling, but where current price is positioned within its recent range.
When price approaches an extreme of that range, the market may be entering a condition where further movement deserves closer examination.
For example, consider a market that continues making higher highs. Price appears strong, but Williams %R may no longer confirm the same degree of internal strength. The difference does not automatically mean that price must reverse. It indicates that price and the selected indicator are no longer behaving in complete agreement.
That disagreement is the information that divergence analysis attempts to capture.
The PatternSmart approach therefore treats Williams %R divergence as an analytical observation rather than an isolated buy or sell instruction.
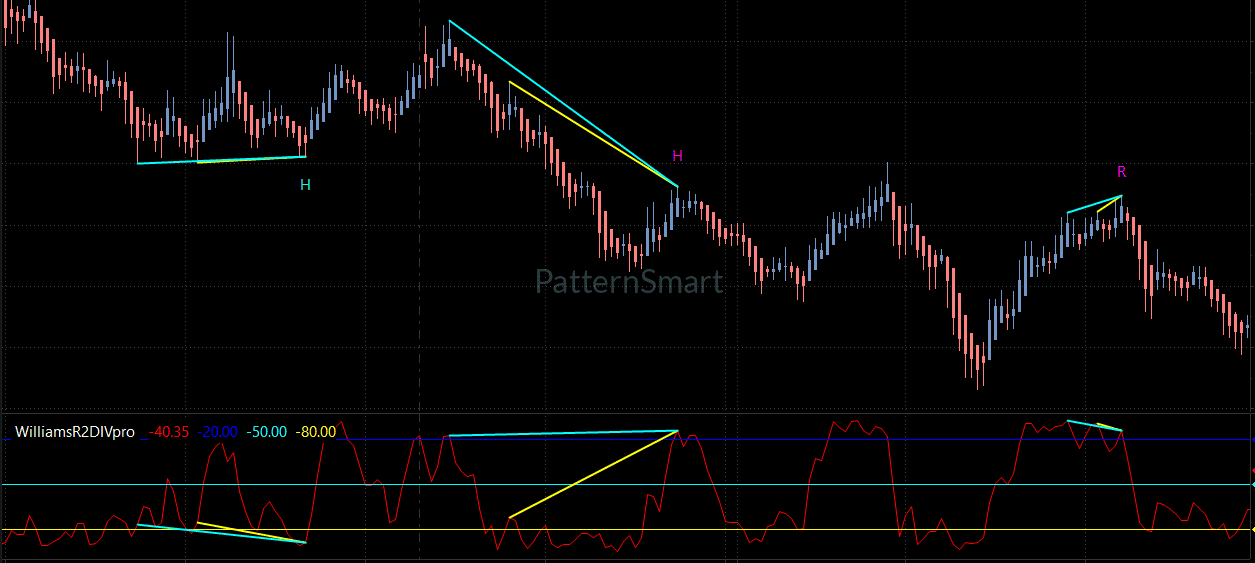
What Is Williams %R Double Divergence?
Traditional divergence compares price behavior with an indicator and looks for disagreement between the two.
The Double Divergence methodology applies a confirmation-oriented framework to this relationship.
The analytical process can be viewed as:
Price Action → Indicator Behavior → Divergence → Context → Confirmation → Interpretation
This distinction is important.
A divergence does not guarantee a reversal, and it does not predict future price movement with certainty. It identifies a change in the relationship between price and the selected indicator that may warrant further analysis.
With Williams %R, the emphasis is particularly relevant to:
- Relative price positioning
- Market extremes
- Overextended movement
- Mean reversion
- Reversal potential
These characteristics make Williams %R Double Divergence naturally suited to range-bound and mean-reversion environments, as well as swing and counter-trend analysis.
Regular and Hidden Divergence
Williams %R Double Divergence Pro supports four major divergence categories:
- Regular Bullish Divergence
- Regular Bearish Divergence
- Hidden Bullish Divergence
- Hidden Bearish Divergence
Regular divergence is generally associated with situations where price movement and indicator behavior show disagreement that may provide information about a potential change in market conditions.
Hidden divergence provides a different analytical perspective and can be useful when examining continuation within a broader market structure.
The important point is that these observations should not be interpreted independently of price action.
A divergence occurring inside a well-defined trading range can present a different analytical context from the same divergence appearing during a powerful sustained trend.
Context comes before conclusions.
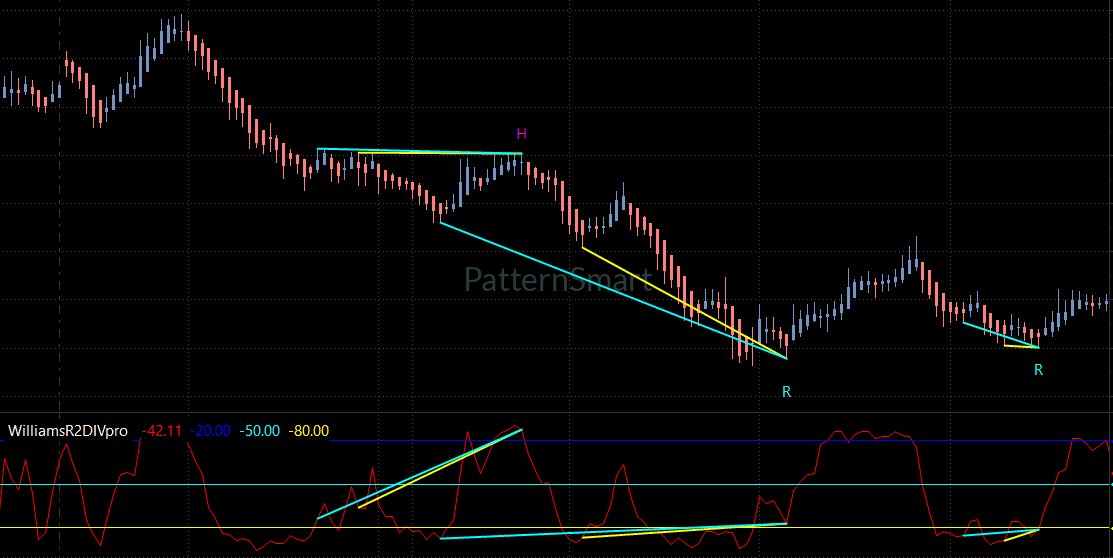
A Confirmation-First Approach
One of the defining principles of PatternSmart Double Divergence is confirmation rather than prediction.
Instead of reacting immediately to every divergence, traders can examine several questions:
- What is price currently doing?
- Where is price positioned within its recent range?
- What is Williams %R showing?
- Is there disagreement between price and indicator behavior?
- What does the broader market structure suggest?
- Is additional confirmation available?
This approach helps transform divergence from a simple visual event into a structured analytical process.
Price remains the primary source of information. Williams %R provides another perspective, while Double Divergence helps organize the relationship between the two. Additional evidence from market structure, support and resistance, volatility, or higher-timeframe analysis can then be considered before reaching a conclusion.
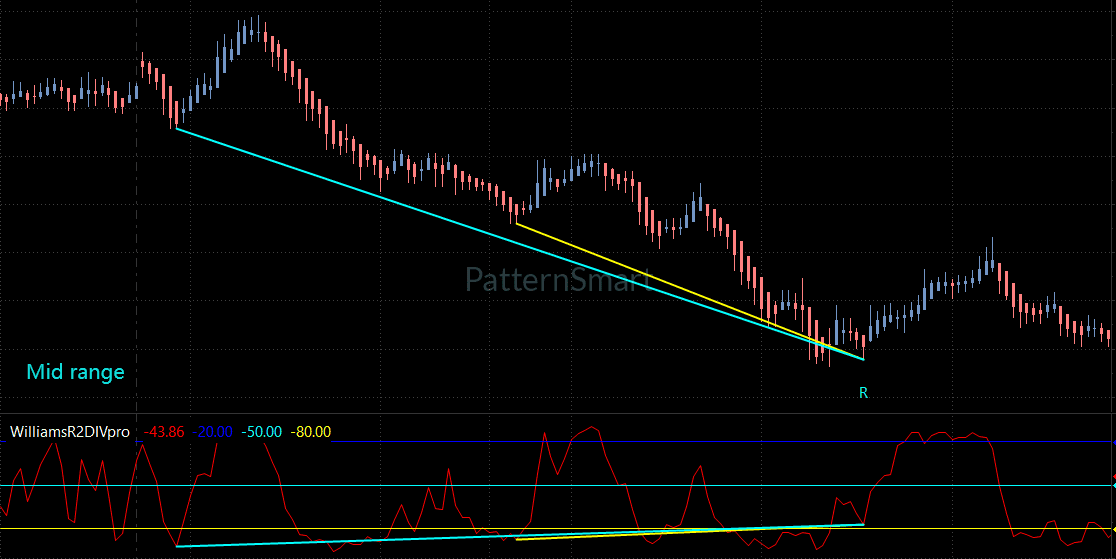
Why Market Context Matters
Williams %R Double Divergence is particularly relevant when price becomes extended.
However, an extreme condition does not necessarily mean that a reversal is imminent.
Strong trends can remain extended for considerable periods, which is why Williams %R Double Divergence should be interpreted with appropriate market context.
For example:
Range-Bound Market
Repeated movement between established boundaries can make relative price positioning particularly informative. Divergence near a range extreme may provide additional information for mean-reversion analysis.
Extended Directional Movement
When price continues moving in one direction while Williams %R behavior begins changing, divergence can highlight a potential deterioration in the agreement between price and indicator behavior.
Counter-Trend Analysis
A divergence observation can become one component of a broader counter-trend analysis, but additional confirmation remains important.
This is also why the Indicator Knowledge Base identifies strong sustained trends as a limitation for Williams %R-based analysis.
Williams %R Double Divergence Pro for MultiCharts
MultiCharts is designed around systematic analysis, strategy development, backtesting, optimization, and structured trading workflows.
This makes it a natural environment for traders and strategy developers who want to incorporate objective technical observations into a repeatable analytical process.
Williams %R Double Divergence can complement this environment by adding a structured divergence perspective to MultiCharts charts and analytical workflows.
The platform does not change the Double Divergence methodology. The same analytical principles apply regardless of implementation; MultiCharts provides the environment in which those principles are applied.
For MultiCharts users, the practical emphasis can therefore be placed on:
- Systematic analysis
- Structured workflows
- Strategy development
- Repeatable technical evaluation
- Portfolio-level analysis
- Analytical discipline
PatternSmart’s approach is to integrate divergence analysis into that workflow rather than treat the indicator as a standalone trading system.
Configurable Double Divergence Pro Features
Williams %R Double Divergence Pro provides configurable controls for signal generation, structural evaluation, filtering, alerts, and chart presentation.
Select the Divergence Types You Need
The following Signal Generation features are available:
- Show Regular Bullish
- Show Regular Bearish
- Show Hidden Bullish
- Show Hidden Bearish
Each setting independently controls whether its corresponding divergence type is calculated and displayed.
This allows the chart to focus on the particular divergence categories relevant to the user’s analytical workflow.
Wait 1 Bar
Wait 1 Bar controls whether the indicator requires one completed confirmation bar before finalizing a detected Double Divergence signal.
When enabled, the indicator waits for the next bar to completely close before confirming the signal. When disabled, confirmation occurs after the internal divergence conditions have been satisfied.
The default value is True.
This setting therefore controls confirmation timing, not the underlying divergence methodology.
Enhanced Mode
Enhanced Mode applies additional structural validation to an eligible divergence signal.
It is a Signal Filtering feature rather than a separate divergence calculation. Its default value is False.
It works naturally alongside Wait 1 Bar, Filter Length, and Divergence Lookback when users are evaluating different approaches to structural validation.
Divergence Bar Range
Divergence Bar Range defines the structural search range used when identifying potential divergence anchor points.
It provides three documented choices:
- ShortRange — relatively compact divergence structures
- MidRange — intermediate structural relationships
- LongRange — broader historical divergence structures
The default is ShortRange.
Changing this setting can influence structural search distance, divergence selection, signal frequency, and chart coverage.
Divergence Lookback
Divergence Lookback controls the number of historical bars evaluated when identifying local swing highs and swing lows.
The default value is 5.
Increasing the value generally requires larger structural movements before a swing point is recognized, while reducing it allows smaller movements to qualify.
Filter Length
Filter Length controls the internal smoothing period used during structural evaluation.
The default value is 5.
A higher value produces smoother structural evaluation, while a lower value produces more responsive structural evaluation.
These three Advanced Parameters work together rather than operating as isolated strategy rules:
Divergence Bar Range → Divergence Lookback → Filter Length → Optional Enhanced Mode → Signal Confirmation
[Get Started With WilliamsR Double Divergence Pro for MultiCharts]
Looking for the complete mathematical breakdown, step-by-step optimization guides, and advanced trading strategies? Explore our comprehensive documentation:
Visit the Technical Inputs Manual: Double Divergence Pro for full parameter tuning.
Read the master guide on the Double Divergence Indicator Series.