To debug indicator signals bar by bar, you need to transition from looking at a completed chart to observing the indicator’s logic as it unfolds in real-time. This process is essential for identifying repainting issues or logical errors that only appear during live calculation.
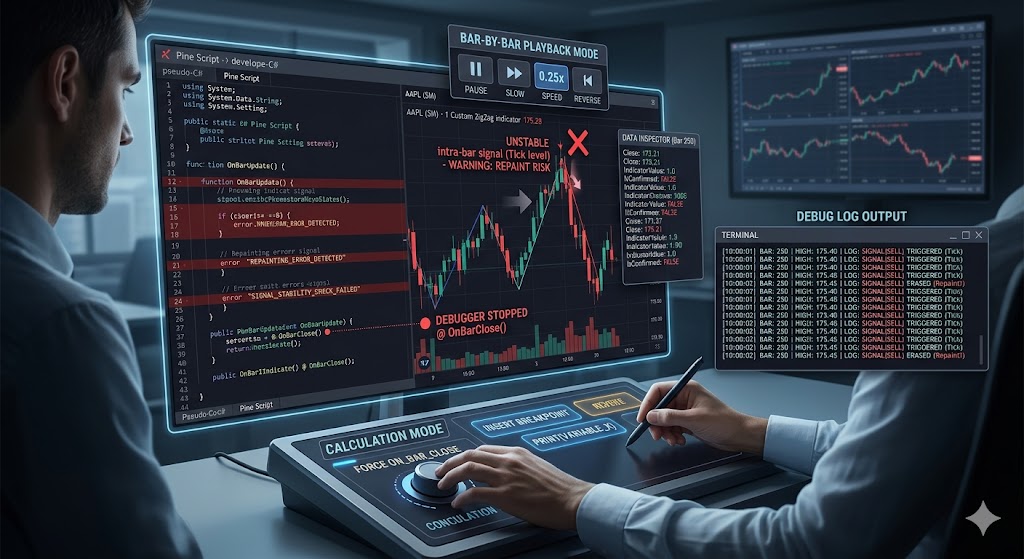
1. Use a “Playback” or “Visual Backtest” Mode
Most professional trading platforms (like NinjaTrader, Sierra Chart, or TradingView) offer a market replay or bar-replay feature.
- The Process: Load your indicator on a chart and start the replay at a slow speed.
- What to Watch: Observe if a signal appears on a bar, then disappears or moves several bars later. If the signal “flickers” or vanishes after the bar closes, you have found a repainting bug.
2. Print-to-Output Debugging (The “Log” Method)
The most reliable way to see what the indicator is “thinking” at any specific moment is to print the internal variables to an output window or log file for every bar.
In your code, add print statements for the specific values that trigger your signal:
- NinjaScript (C#):
Print("Bar: " + CurrentBar + " | Value: " + myValue); - Pine Script:
plotchar(myValue, "Debug Value", "")or use thelog.info()function. - Python/Pandas:
print(df[['timestamp', 'signal_column']].tail(10))
Compare these logged values to what you see visually on the chart. If the log says a signal was triggered at 10:00 AM, but the chart doesn’t show it until 10:15 AM, there is a calculation lag or look-ahead bias.
3. The “Data Window” Inspection
Instead of just looking at the shapes or lines on the chart, use the Data Window (usually Ctrl+D in many platforms).
- Move your cursor bar-by-bar across the chart.
- Watch the numeric values in the Data Window change.
- This helps you spot “NaN” (Not a Number) errors or values that suddenly jump to extreme levels, which often indicate a math error like dividing by zero.
4. Code-Level Step-Through (Advanced)
If you are developing in a language like C# (NinjaScript) or C++ (Sierra Chart), you can attach a debugger (like Visual Studio) to the trading platform.
- Breakpoints: Set a breakpoint on the line of code where the signal is generated.
- Step Over: Step through the code one line at a time to see exactly which condition is failing.
- Watch Window: Monitor how your variables change as each price tick or bar update arrives.
5. Force “On Bar Close” Calculations
A common source of “fake” signals is code that calculates on every tick. To debug this, temporarily force your indicator to only calculate when a bar closes.
- If the signals become stable and stop flickering, the issue is with how your logic handles intra-bar price fluctuations.
- If the signals are still incorrect, the logic error is likely in how you are referencing historical data (e.g., calling
[1]for the previous bar incorrectly).
Summary Checklist for Debugging
- Is it a calculation error? Check the Data Window for logical consistency.
- Is it a timing error? Use Replay Mode to see if signals move after the fact.
- Is it a math error? Use Print/Log statements to see the raw numbers behind the visual plots.
Click here If you are looking for Professional Custom Trading Software Development Services