For traders and algorithmic developers, the “Holy Grail” is often seen as a strategy that works universally. However, anyone who has moved from trading Tech Stocks to Forex or Gold knows that markets have distinct “personalities.” A 14-period RSI that identifies perfect reversals in a stable blue-chip stock might be completely overwhelmed by the volatility of a crypto altcoin.
To build a robust trading portfolio, you must understand how to normalize data so you can objectively compare how your indicators perform across different asset classes. Here is a professional framework for cross-market indicator analysis.
1. The Necessity of Normalization
The biggest mistake in cross-market analysis is using raw values. A 50-cent move in a $20 stock is massive (2.5%), while a 50-cent move in Gold is negligible. To compare performance, you must translate indicator signals into a common language.
- Percent Change vs. Absolute Price: Instead of measuring how many “points” an indicator captured, measure the percentage return or logarithmic return.
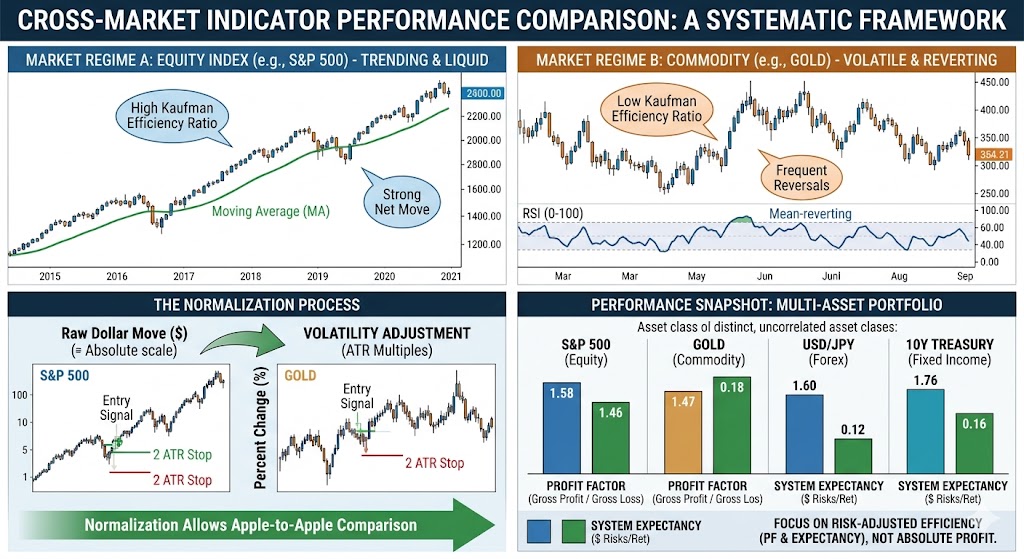
- Volatility Normalization (The ATR Method): Use the Average True Range (ATR) to adjust your expectations. If you are comparing a Moving Average crossover on the S&P 500 versus Crude Oil, express your stop-losses and targets in “Multiples of ATR” (e.g., a 2-ATR stop). This allows you to see if the indicator provides the same risk-adjusted return regardless of the asset’s dollar volatility.
2. Identifying “Market Personality” Through Statistics
Before declaring an indicator “better” on one market, you must analyze the underlying market structure of each asset.
- Mean-Reverting vs. Trending Markets: Some markets, like Forex pairs (e.g., EUR/USD), tend to spend more time in ranges (mean-reverting). Others, like Growth Stocks, tend to trend for long periods.
- The Efficiency Ratio: Calculate the “Kaufman Efficiency Ratio” for each market. This ratio measures the net move divided by the sum of absolute moves. An indicator that relies on clean trends will naturally underperform on markets with a low Efficiency Ratio, regardless of the quality of the indicator itself.
3. Comparing Profit Factor and Expectancy
When looking at backtest results across five different markets, don’t just look at the Net Profit. Use these two metrics for a fair comparison:
- Profit Factor: (Gross Profit / Gross Loss). A Profit Factor of 1.5 on Bitcoin and 1.5 on the 10-Year Treasury Note means the indicator is equally efficient at managing the “cost of doing business” in both environments, even if the dollar amounts are wildly different.
- System Expectancy: This calculates how much you can expect to make on every dollar risked.
- Formula:
(Win Rate * Average Win) - (Loss Rate * Average Loss)
- Formula:
4. Correlation and Overlap Analysis
If you run the same indicator on Apple (AAPL) and Microsoft (MSFT), you aren’t necessarily testing “cross-market” performance—you are testing the same sector.
To truly compare performance, test across uncorrelated assets:
- An Equity Index (S&P 500)
- A Commodity (Gold or Oil)
- A Currency Pair (USD/JPY)
- A Fixed Income product (10-Year Yields)
If the indicator maintains a positive expectancy across these four distinct “regimes,” you have found a robust mathematical edge.
5. Implementation: The Walk-Forward Benchmark
The final step is to perform a Walk-Forward Analysis on each market simultaneously.
- In-Sample: Tune the indicator to Market A.
- Out-of-Sample: Run those same settings on Market B.
If the performance holds up, the indicator is capturing a fundamental truth about human psychology or supply/demand. If the performance collapses, the indicator was simply “curve-fitted” to the specific noise of the first market.
Conclusion
Comparing indicator performance across markets isn’t about finding the market where you made the most money; it’s about finding the market where the indicator’s logic is most reliable and efficient. By normalizing for volatility and focusing on risk-adjusted metrics like Profit Factor and ATR-multiples, you can build a diversified strategy that isn’t dependent on a single asset class.