Repainting is one of the most common reasons a trading strategy looks profitable in historical testing but performs poorly in live markets. A repainting indicator can change, move, remove, or rewrite its past signals after new price data becomes available. While this may make the historical chart look clean and accurate, it can create a misleading view of how the indicator actually behaved in real time.
For traders, developers, and strategy builders, understanding repainting is essential. A backtest is only useful when it reflects decisions that could have realistically been made at the time. If an indicator uses future information to improve past signals, the backtest result may become unreliable.
What Is a Repainting Indicator?
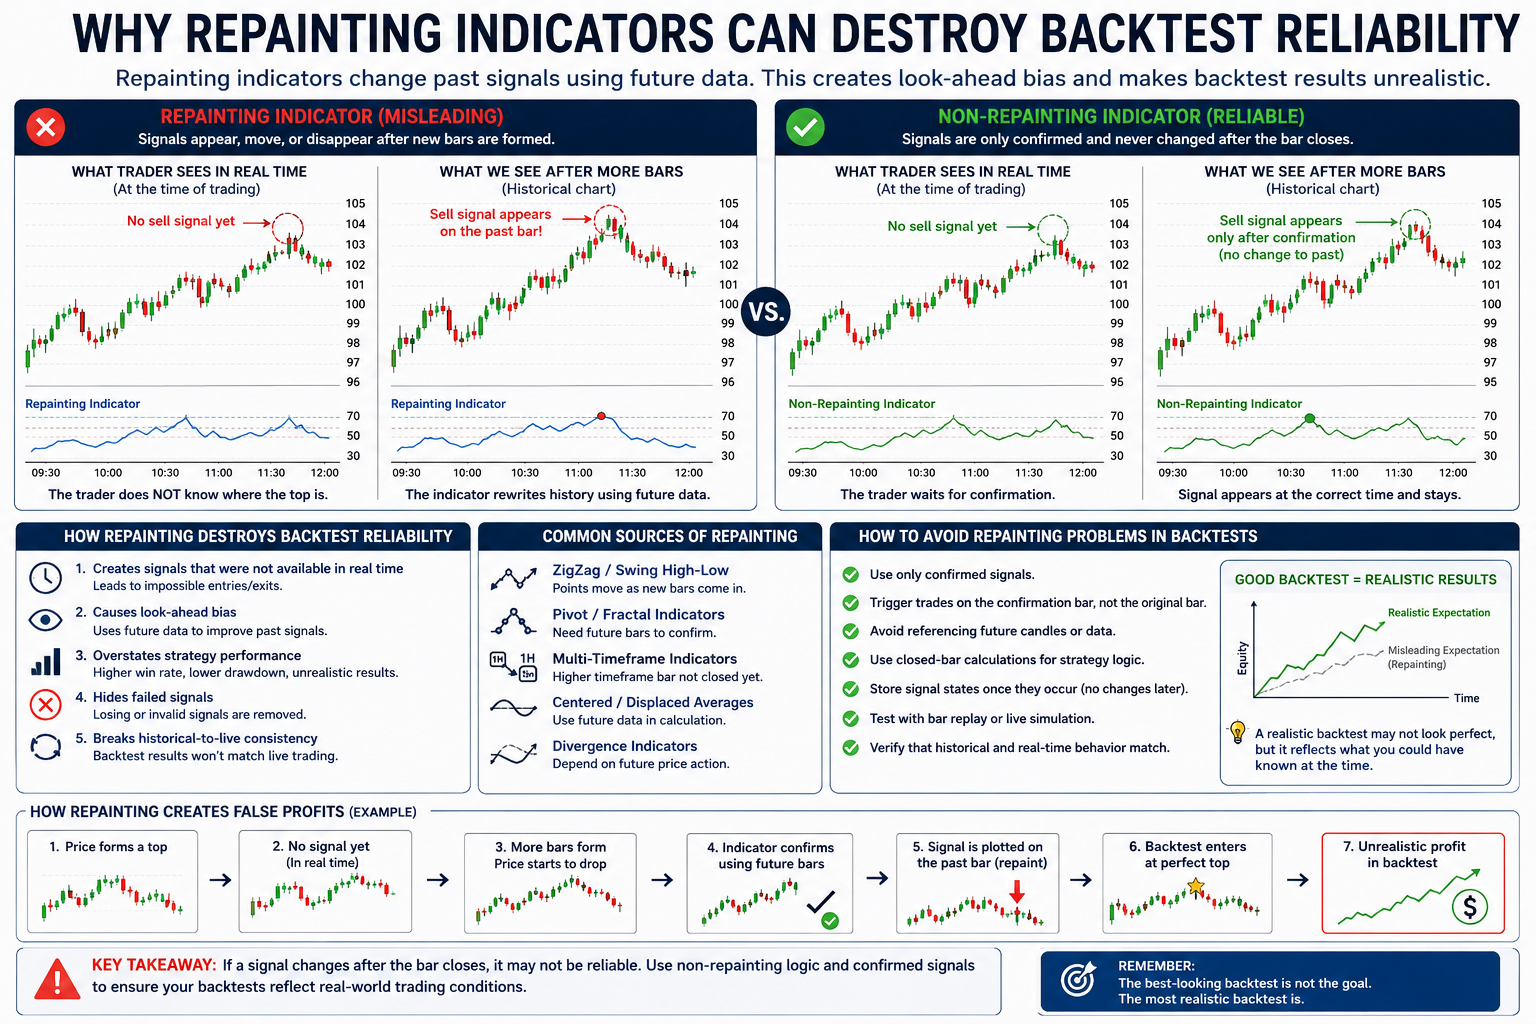
A repainting indicator is an indicator that changes its previously displayed values or signals after later bars are formed. This means that a buy or sell signal shown on a historical chart may not have existed at that exact moment in real-time trading.
Repainting can happen in many ways, including:
- A signal appears on a past bar only after several future bars confirm it
- A signal disappears after price moves in the opposite direction
- A pivot, swing high, swing low, or ZigZag point moves as new data comes in
- A multi-timeframe signal changes before the higher-timeframe candle closes
- A plotted value is recalculated using future bars
Not all repainting is intentionally misleading. Some indicators require confirmation before they can define a final signal. However, when repainting behavior is not clearly understood, it can severely distort backtest results.
Why Repainting Destroys Backtest Reliability
1. It Creates Signals That Were Not Available in Real Time
The biggest problem with repainting is that historical signals may appear as if they were known earlier than they actually were.
For example, a reversal indicator may show a perfect sell signal at the exact high of a move. However, that signal may only be confirmed several bars later. In live trading, the trader would not have known the signal at the top. Entering at the historical signal price would be impossible.
This creates unrealistic backtest entries and exits.
2. It Produces Look-Ahead Bias
Look-ahead bias occurs when a strategy uses information from the future to make a decision in the past. Repainting indicators often introduce this problem automatically.
A strategy may appear to detect tops, bottoms, breakouts, and reversals with high accuracy because the indicator has already adjusted itself using future price action. The result is a backtest that looks much better than what could be achieved in live trading.
3. It Overstates Strategy Performance
When repainting signals are used in a backtest, the results may show inflated performance metrics, such as:
- Higher win rate
- Lower drawdown
- Better profit factor
- More accurate entries
- Cleaner exits
- Fewer losing trades
These results can give traders false confidence. A strategy may look stable on historical data but fail when traded live because the historical signals were not real-time actionable.
4. It Hides Failed Signals
Some repainting indicators remove or change signals that do not work. This can make the chart look much cleaner than it was during live market conditions.
For example, a buy signal may appear during a forming candle, then disappear after price falls. If the chart only shows the final version, the failed signal is hidden from the trader and the backtest.
This makes risk evaluation inaccurate.
5. It Breaks Historical-to-Live Consistency
A reliable trading strategy should behave the same way in historical testing, real-time simulation, and live execution. Repainting breaks this consistency.
A signal may exist in the historical chart but not appear in real time. Or a real-time signal may disappear after the bar closes. This creates a mismatch between backtest performance and live trading behavior.
When historical and live behavior are different, the backtest cannot be trusted.
Common Indicators That May Repaint
Repainting can occur in many types of indicators, especially those that depend on confirmation or future bars.
Common examples include:
- ZigZag indicators
- Pivot high and pivot low indicators
- Swing point indicators
- Fractal indicators
- Centered moving averages
- Certain divergence indicators
- Multi-timeframe indicators
- Future-looking support and resistance tools
- Reversal signals confirmed after several bars
These tools can still be useful for analysis, but they must be handled carefully when used in automated strategies or backtesting.
Repainting vs. Confirmation Delay
It is important to separate repainting from confirmation delay.
A confirmation-based indicator may wait several bars before confirming a signal. This is acceptable if the signal is plotted and tested at the time it becomes confirmed, not on the original historical bar.
The problem occurs when the confirmed signal is plotted back on the earlier bar, making it look like the trader could have entered sooner. This creates misleading results.
For accurate testing, the strategy should use the confirmation bar as the actionable signal bar.
How to Detect Repainting in an Indicator
To check whether an indicator repaints, traders and developers can use several methods:
- Watch the indicator in real time and compare it with historical output later
- Use bar replay or market replay
- Print signal values bar by bar
- Store signal values in a data series and verify whether past values change
- Compare real-time alerts with historical chart signals
- Test the indicator using closed-bar logic only
- Avoid relying on signals that appear before confirmation is complete
A practical rule is simple: if a signal changes after the bar has closed, it may not be reliable for backtesting unless the logic is specifically designed to handle that behavior.
How to Make Backtests More Reliable
To improve backtest reliability, strategy developers should avoid using future-looking signals as if they were real-time signals.
Best practices include:
- Use only confirmed signals
- Trigger trades on the confirmation bar, not the original repainting bar
- Avoid referencing future candles
- Use closed-bar calculations for strategy logic
- Store signal states permanently once they occur
- Separate candidate signals from confirmed signals
- Test with market replay or live simulation
- Verify that historical and real-time behavior match
A non-repainting strategy may show less impressive results than a repainting one, but the results are usually more realistic and useful.
Why This Matters for Automated Trading
Repainting is especially dangerous in automated trading because the strategy depends on precise signal timing. If the backtest assumes signals existed earlier than they did, the automated system may be optimized around impossible trades.
This can lead to poor live performance, unexpected drawdowns, and strategy failure. For automated trading, signal availability is just as important as signal accuracy.
A signal is only valid if it existed at the time the trade decision was made.
Conclusion
Repainting indicators can destroy backtest reliability because they may rewrite historical signals using future data. This creates look-ahead bias, hides failed signals, inflates performance metrics, and causes a major gap between historical testing and live trading.
Repainting indicators are not always useless, but they must be understood and tested correctly. For reliable backtesting, traders should use confirmed signals, avoid future-looking logic, and make sure every trade entry and exit was possible in real time.
A realistic backtest is not the one with the best-looking performance curve. It is the one that accurately reflects what the trader or strategy could have known at each bar.