The three charts present a valuable educational sequence rather than three isolated trading examples. Although each chart highlights a different Divergence Bar Range setting (Short, Mid, and Long), together they demonstrate one of the central principles of the PatternSmart Double Divergence methodology: divergence should be viewed as analytical evidence that gains significance through confirmation and market context, not as an isolated prediction.
Each example illustrates how changing the divergence evaluation range influences the types of market behavior that become visible, while the underlying methodology remains focused on confirmation, structured interpretation, and disciplined analysis.
Understanding the Three Divergence Bar Ranges
Although the underlying MACD indicator remains unchanged, the divergence range changes the portion of price structure being evaluated.
- Short Range focuses on relatively recent swings and is more responsive to short-term changes.
- Mid Range captures intermediate market structure, filtering some shorter fluctuations.
- Long Range emphasizes major swings and broader market trends while ignoring much of the smaller market noise.
Rather than viewing one setting as superior, these examples demonstrate that each range provides a different perspective on the same market.
Chart 1 — Short Divergence Bar Range
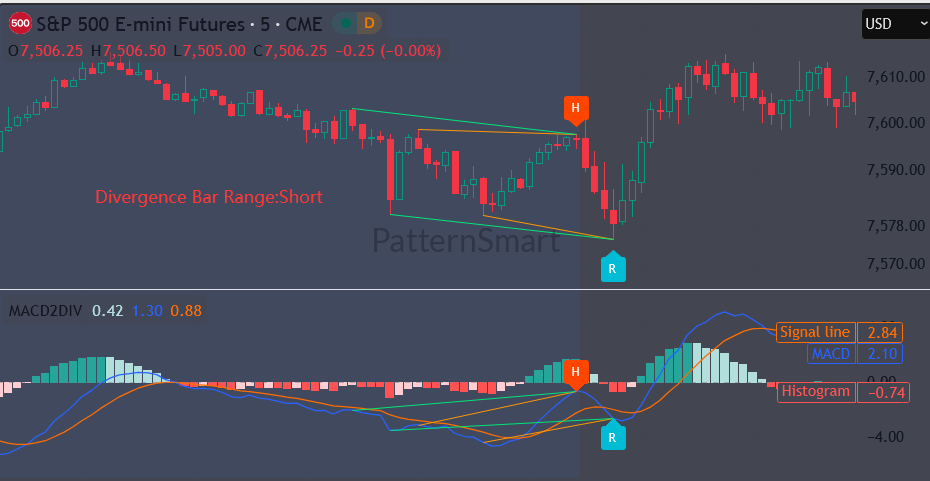
The first chart illustrates a Bearish Hidden Divergence.
Price forms a lower high, while the MACD develops a higher high. Although the oscillator appears stronger, price fails to confirm that strength by producing a higher swing high. This disagreement creates Hidden Divergence.
At the same time, the MACD histogram begins to contract, indicating that bullish momentum is no longer expanding even though the MACD itself temporarily pushes higher.
This combination represents an important concept.
The divergence itself does not predict an immediate decline.
Instead, it suggests that the recent rally deserves closer examination because indicator behavior is no longer fully aligned with price.
The subsequent decline provides additional confirmation that sellers regained control after the temporary rally.
From an educational perspective, this example demonstrates how Hidden Divergence can contribute to evaluating whether an existing bearish environment remains technically intact following a corrective advance.
Chart 2 — Mid Divergence Bar Range
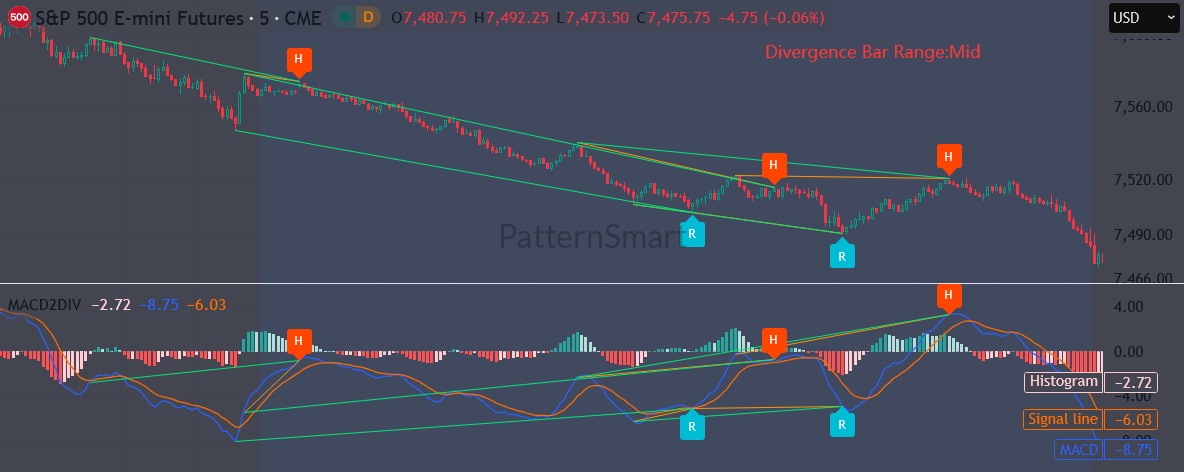
The second chart presents a more complex sequence.
Instead of showing a single divergence event, it highlights multiple divergence relationships developing throughout an established downtrend.
The overall market structure remains bearish, with price continuing to produce lower highs and lower lows.
Within this trend, several Hidden Divergence signals appear during corrective rallies.
Each signal by itself represents only an observation.
However, an important characteristic emerges when they are viewed collectively.
Every recovery attempt fails to produce a meaningful change in market structure.
Meanwhile, MACD repeatedly shows stronger momentum than price itself, creating successive Hidden Divergence observations that continue supporting the dominant bearish trend.
The final divergence near the right side of the chart occurs immediately before another wave of selling accelerates.
This chart demonstrates one of the greatest strengths of confirmation-based analysis.
Rather than reacting to a single divergence, traders observe a series of consistent technical messages:
- Bearish market structure remains intact.
- Corrective rallies fail to break previous highs.
- Hidden Divergence repeatedly supports trend continuation.
- MACD momentum aligns with the larger bearish structure.
Each observation reinforces the previous one, increasing analytical confidence without implying certainty.
Chart 3 — Long Divergence Bar Range
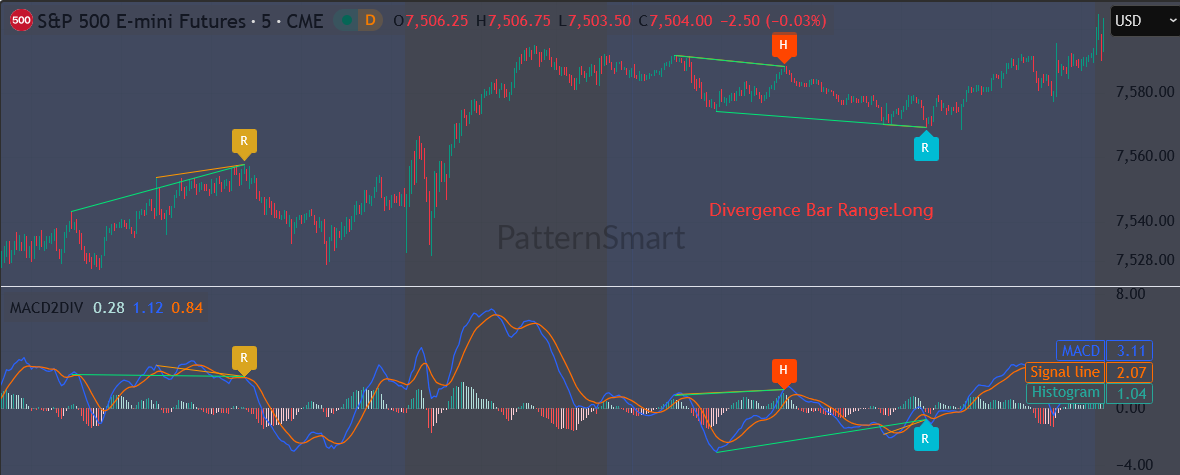
The third chart illustrates how extending the divergence evaluation period shifts attention from short-term fluctuations toward major market structure.
Two separate signals appear.
The first is a Bullish Regular Divergence near the left side of the chart.
Price records a lower low while MACD establishes a higher low.
This suggests that downside momentum is no longer fully confirming continued price weakness.
Following this divergence, buyers gradually regain control and price begins developing a sustained advance.
Later in the chart, a Bearish Hidden Divergence develops during a pullback inside the broader uptrend.
Price forms a lower high while MACD creates a higher high.
Although this represents Hidden Divergence from the oscillator’s perspective, the broader bullish structure remains largely intact.
Rather than producing a major reversal, the market experiences only a temporary correction before buyers eventually resume upward movement.
This example highlights another important lesson.
Divergence should always be interpreted within the context of the larger trend.
The same divergence category may produce different market outcomes depending on surrounding price structure.
Connecting the Three Examples
Viewed together, these charts demonstrate how the same MACD Double Divergence methodology adapts to different analytical horizons.
The Short Range emphasizes immediate swing relationships and is naturally more responsive to recent price action.
The Mid Range begins filtering smaller fluctuations, revealing how repeated divergence observations can strengthen confidence in an established trend.
The Long Range focuses on broader market structure, helping analysts identify significant momentum shifts while ignoring much of the short-term market noise.
Importantly, none of these settings changes the underlying analytical philosophy.
Only the perspective changes.
The methodology remains identical:
- Observe the relationship between price and the MACD.
- Identify Regular or Hidden Divergence.
- Evaluate the surrounding market structure.
- Seek additional technical confirmation.
- Form an objective analytical interpretation rather than an automatic trading decision.
The Role of Confirmation
One of the most consistent themes across all three charts is that divergence never appears in isolation.
Every meaningful observation is supported by additional evidence.
Examples include:
- Existing trend direction.
- Swing high and swing low structure.
- MACD histogram expansion or contraction.
- Failure of price to confirm indicator movement.
- Subsequent price behavior following the divergence.
This illustrates why the PatternSmart Double Divergence methodology places confirmation at the center of the analytical process.
A divergence identifies an area deserving closer examination, but confirmation from price action, market structure, and the underlying indicator strengthens analytical confidence. It does not create certainty or guarantee a particular outcome.
Educational Takeaways
These three ES futures charts demonstrate that divergence is best understood as part of a structured analytical framework rather than as a standalone signal.
The Short Divergence Bar Range highlights early changes in swing behavior, making it useful for evaluating recent market developments. The Mid Range emphasizes intermediate trends, where multiple divergence observations can reinforce one another through confirmation. The Long Range filters short-term fluctuations to reveal broader momentum shifts and major structural changes.
Across all three examples, the MACD Double Divergence indicator does not attempt to predict future price movement. Instead, it provides additional technical evidence that helps traders compare price action with underlying momentum. When that evidence is interpreted alongside trend structure and subsequent price confirmation, it contributes to a more disciplined and objective assessment of market conditions.
Ultimately, these charts reinforce an essential principle of professional technical analysis: the strongest conclusions are rarely drawn from a single observation. They emerge when multiple forms of technical evidence align to create a coherent, confirmation-based view of the market.
Read the master guide on the Double Divergence Indicator Series.
Visit the Technical Inputs Manual: Double Divergence Pro for full parameter tuning.
The MACD Double Divergence Pro indicator is available in these platforms: Ctrader, MetaTrader(MT4, MT5), NinjaTrader 8, MultiCharts, MultiCharts x.NET, Tradingview(subchart only), Prorealtime(subchart only), SierraChart.