NVDA Daily Chart Analysis: Decoding Momentum Double Divergence in Price Structure
Market Overview
NVIDIA Corporation (NVDA) shows a dynamic sequence of market conditions on its daily candlestick chart, transitioning from an established multi-month uptrend into a complex consolidation pattern, followed by a bullish resumption to new highs.
The primary feature of this chart is the strong interplay between price action around key psychological levels and multi-point momentum signals shown in the subchart indicators. Between April and July, NVDA expanded from a low near $165.00 up toward $220.00, before consolidating in a well-defined range between $190.00 and $215.00. Recent price action demonstrates a breakout continuation above the prior consolidation high, bringing price toward the $222.00–$223.00 region.
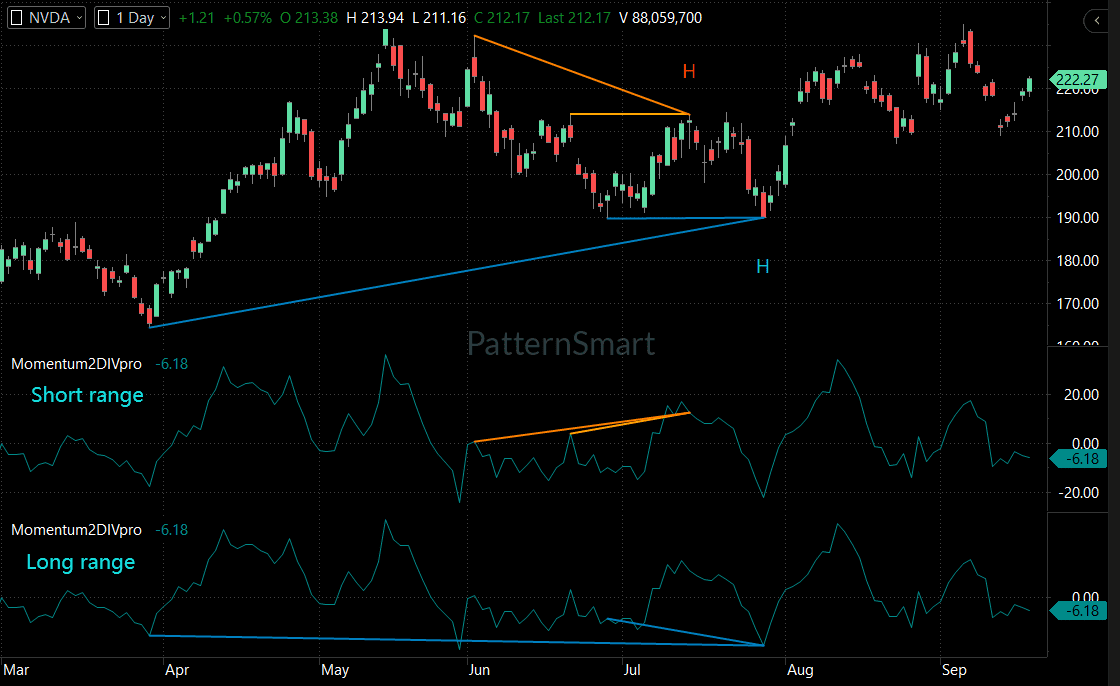
Chart Setup
- Instrument: NVIDIA Corporation
- Symbol: NVDA
- Timeframe: Daily (1 Day)
- Chart Type: Candlestick Price Chart
- Indicators: Momentum Double Divergence (
Momentum2DIVproset to Short range and Long range subcharts) - Visible Price Range: ~$165.00 to ~$223.00
Price Action Analysis
The visible price structure reveals several distinct phases:
- Initial Expansion: Starting from the late-March trough near $165.00, price rallied aggressively through April and May, making a series of higher highs and higher lows that topped near $220.00.
- Consolidation & Lower Highs: Following the peak near $220.00, price entered a corrective phase, forming a subsequent lower high near $212.00 in mid-July.
- Double Bottom Support Test: During late July, price retraced back to test the $190.00 region, forming a higher low relative to the major April low of $165.00.
- Breakout & Expansion: After holding support at $190.00, strong buying pressure re-emerged, propelling NVDA past the prior resistance zone at $212.00–$215.00 to mark a new peak above $222.00.
Trend Analysis
- Primary Trend: Bullish. The broad structural pattern from April through September remains higher highs and higher lows.
- Short-Term Trend: Bullish Re-expansion. The pullback into late July was a secondary corrective phase within the primary uptrend. The sharp recovery through August and September confirmed trend continuation.
Key Support and Resistance Levels
- Major Resistance Zone ($220.00 – $223.00): Represents the major swing highs established in June and recently retested/broken in August/September.
- Intermediate Resistance / Pivot ($212.00): The mid-July local swing high that acted as resistance before being cleared during the recent breakout.
- Major Support Zone ($190.00): A structural support base reinforced by the low established in July, maintaining the broader higher-low structure above the $165.00 trough.
- Primary Swing Support ($165.00): The major low from late March/early April, representing the structural invalidation point for the multi-month primary uptrend.
Momentum Analysis
The lower panels display two subchart momentum oscillators tracking different lookback windows: Short range and Long range. Measuring momentum across multiple lookback windows allows the identification of multi-point momentum exhaustion or structural alignment—known as Double Divergence.
Rather than comparing standard single-peak or single-trough divergence, Double Divergence compares current price extremes across two historical reference points. This multi-point validation filters out false early signals during persistent trend moves.
Signal-by-Signal Analysis
Signal 1: Bearish Double Divergence (June – July Local Top)
- Location: Appearing on the upper subchart (Short range momentum indicator) across June and July.
- Price Movement: Price formed a high near $220.00 in June, pulled back, and then attempted a secondary rally in mid-July to approximately $212.00. The annotated line on price indicates a lower high across these swing points.
- Indicator Movement: Across the same period, the Short-range momentum oscillator printed higher peaks (annotated with orange lines on both price and oscillator).
- Signal Classification: Hidden Bearish Double Divergence.
- Context & Interpretation: In a local pullback or distribution sequence, when price makes lower highs while the momentum indicator prints higher peaks across two reference points, it signifies underlying momentum saturation without price acceptance. Supply remains heavy overhead, indicating that buyers were unable to convert increasing indicator momentum into higher price levels.
- Subsequent Outcome: Following this signal, price was rejected from the $212.00 level and underwent a sharp decline back down to the $190.00 support zone.
Signal 2: Bullish Double Divergence (April – July Structural Low)
- Location: Appearing on the lower subchart (Long range momentum indicator) connecting the April major low to the late-July swing low.
- Price Movement: Price printed a major trough near $165.00 in April, followed by a higher structural trough near $190.00 in late July (annotated with cyan lines).
- Indicator Movement: The Long-range momentum indicator made lower troughs across the same multi-month period, pushing deeper relative to the April baseline.
- Signal Classification: Hidden Bullish Double Divergence.
- Context & Interpretation: Hidden Bullish Double Divergence occurs within an established primary uptrend when price holds a higher low relative to previous swing points, even as the momentum oscillator prints lower troughs across multiple reference points. This indicates that despite strong downward indicator pushes, sellers failed to break price structure. The underlying structural strength remains with the buyers.
- Subsequent Outcome: After reaching the $190.00 region with this signal in place, price staged a powerful bullish reversal, breaking out through $212.00 resistance and reaching new highs above $222.00.
Confirmation
The Double Divergence signals on NVDA provided key early warnings, but their execution depended on structural confirmation by price action:
- Bearish Confirmation: The Hidden Bearish Double Divergence was confirmed when price broke below the minor consolidation support around $205.00 following the mid-July rejection, pushing down to $190.00.
- Bullish Confirmation: The Hidden Bullish Double Divergence at $190.00 was confirmed when price produced strong green daily candles off the $190.00 support level, subsequently breaking above the local lower high at $212.00. This structural breakout validated the resumption of the broader uptrend.
Technical Scenarios
Bullish Scenario (Trend Resumption)
- Conditions: Price maintains acceptance above the broken resistance zone at $212.00–$215.00 on any minor pullbacks.
- Target/Expectation: Expansion past the recent $222.27 high toward uncharted territory, guided by the larger multi-month higher-high structure.
Bearish Scenario (Failed Breakout / Re-range)
- Conditions: Price fails to hold above $212.00 and falls back inside the prior $190.00–$212.00 consolidation range.
- Target/Expectation: A drop back toward the $200.00 mid-range pivot or a retest of the major $190.00 support base.
Neutral / Range Scenario
- Conditions: Price fluctuates between $212.00 and $223.00, absorbing overhead supply without initiating a decisive impulse move in either direction.
Risk and Invalidation
- Bullish Invalidation Level: A daily close below the key swing low at $190.00. Falling below this level would break the primary higher-low sequence established since April, invalidating the Hidden Bullish Double Divergence structure and signaling broader market weakness.
- Bearish Invalidation Level: A sustained hold above $223.00. This invalidates any lingering overhead resistance from the June peak, confirming full buyer control.
Key Levels Summary
| Level / Zone | Role | Technical Significance |
| $222.27 – $223.00 | Major Resistance / Breakout Level | Recent swing high and upper boundary of the multi-month range. |
| $212.00 | Former Resistance / Current Support | Mid-July swing high; now serves as a key polarity pivot. |
| $190.00 | Major Structural Support | July higher low; primary invalidation point for the bullish structure. |
| $165.00 | Primary Swing Low | Major base from late March/early April. |
Technical Outlook
NVDA displays a technically healthy market structure where momentum divergence successfully signaled trend transitions. The Hidden Bearish signal in July correctly anticipated short-term weakness down to support, while the multi-month Hidden Bullish signal at $190.00 signaled major buyer absorption prior to the breakout above $220.00. As long as price holds above the $212.00 structural pivot, the broader technical outlook remains constructively bullish.
Educational Conclusion
This NVDA chart demonstrates the value of evaluating momentum across multiple time horizons using Double Divergence. Standard divergence can occasionally trigger prematurely in strong markets. By requiring momentum alignment across two historical reference points, Double Divergence highlights areas where price and momentum truly disconnect. However, traders should always wait for price confirmation—such as key level rejections or structural breakouts—before acting on indicator signals alone.
Frequently Asked Questions
1. What is the difference between standard divergence and Double Divergence?
Standard divergence compares a single recent price extreme to a single indicator peak or trough. Double Divergence uses a three-point structural alignment, cross-referencing two separate historical swing points against current price action to confirm momentum exhaustion across a broader timeframe.
2. Why was the bullish signal on this NVDA chart classified as “Hidden” divergence?
It is classified as Hidden Bullish Double Divergence because price formed a higher low ($190.00 vs $165.00), while the momentum indicator formed lower troughs across the same reference points. Hidden divergence typically signals trend continuation following a pullback.
3. Why are two subcharts (Short range and Long range) used?
Different indicator lookback windows capture different cycles in price structure. The short-range panel captures localized swings (like the July lower high), while the long-range panel captures macro swing points (like the April to July higher low).
4. What level invalidates the current bullish structure on NVDA?
A sustained close below the $190.00 support level would invalidate the higher-low structural pattern established since April.
Looking for the complete mathematical breakdown, step-by-step optimization guides, and advanced trading strategies? Explore our comprehensive documentation:
Visit the Technical Inputs Manual: Double Divergence Pro for full parameter tuning.
Read the master guide on the Double Divergence Indicator Series.