Momentum Double Divergence Analysis: Bullish Divergence, Trend Reversal and Price Action
Market Overview
The daily chart for Microsoft Corporation (MSFT) illustrates a prolonged downtrend that transitions into a multi-month momentum exhaustion phase, eventually leading to a significant bullish trend reversal.
Between late 2025 and early 2026, MSFT experienced sustained selling pressure, driving prices down from above the $450.00 region to a major swing low around $350.00. Throughout this decline, price structure exhibited a series of lower highs and lower lows. However, as the downtrend matured, the downward intensity began to diminish, resulting in a multi-point momentum divergence across both short-range and mid-range parameters before price established a firm bottom and initiated a strong upside expansion toward $500.00.
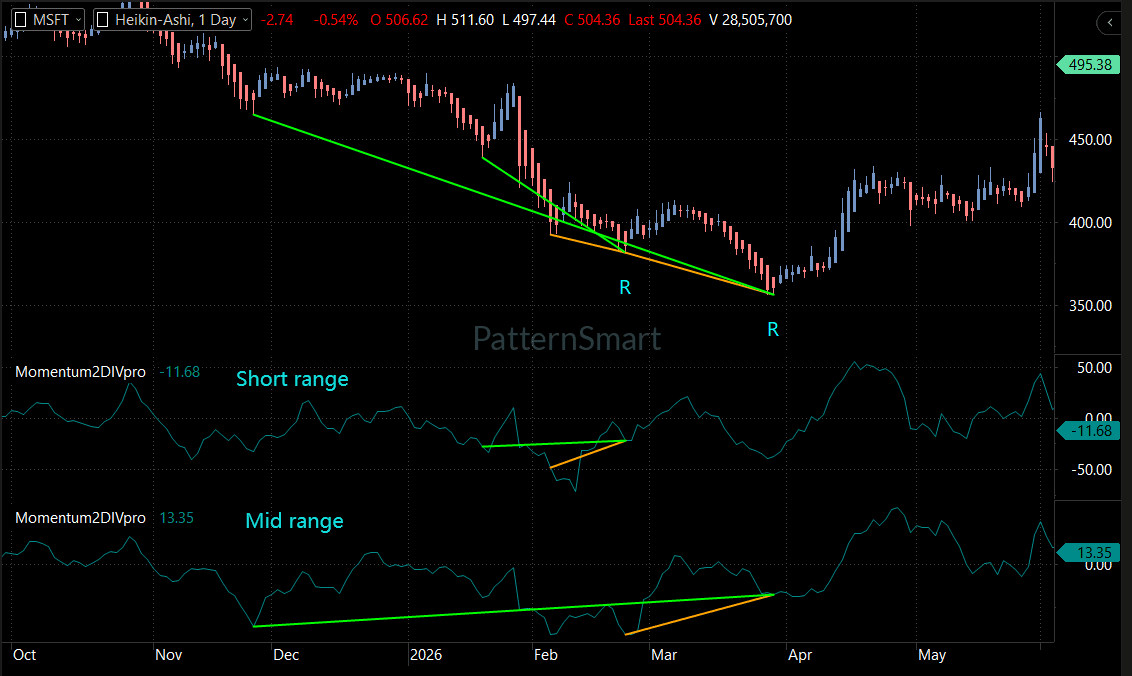
Chart Setup
- Instrument: Microsoft Corporation
- Symbol: MSFT
- Timeframe: Daily (1 Day)
- Chart Type: Heikin-Ashi Candlestick Chart
- Primary Indicators: Momentum Double Divergence Pro (
Momentum2DIVpro) subchart oscillators configured across two separate reference ranges:- Short Range Momentum Oscillator (Top Subchart Panel)
- Mid Range Momentum Oscillator (Bottom Subchart Panel)
Price Action Analysis
The price action on the daily Heikin-Ashi chart exhibits three major structural phases:
- Primary Downtrend Phase (Late 2025 – Early 2026): Price initiated a clear down-leg, forming persistent red Heikin-Ashi bodies with strong downward wicks. This movement established lower swing lows across December 2025, February 2026, and late March 2026.
- Exhaustion & Double Bottom Base (February 2026 – March 2026): In February 2026, price dipped below $400.00 before printing a minor reaction rally. A subsequent sell-off pushed price to a final low near $350.00 in late March 2026. Despite the lower low in price, the candles displayed shorter real bodies, signaling fading downside momentum.
- Bullish Breakout & Structure Shift (April 2026 – May 2026): Following the late-March low near $350.00, price aggressively reversed upward with consecutive green Heikin-Ashi candles. Price rapidly reclaimed previous structural pivot points near $400.00 and $450.00, expanding toward a top visible level around $495.38.
       [450+]  \
                \  Downwards Trend Axis
                 \
       [400]------\------- Pivot Line (Breakout Level)
                   \     /
       [350]--------\---/-- Major Double Divergence Low
                     \_/
                  Mar 2026   --> Reversal Expansion
Trend Analysis
- Primary Trend: Transitioned from Bearish (Q4 2025 – Q1 2026) to Bullish (Q2 2026 onward).
- Short-Term Trend: Strongly Bullish, characterized by higher highs and higher lows through April and May 2026.
- Trend Transition: The broader trend transition occurred when price decisively broke out above the $400.00 horizontal pivot zone following the formation of a Regular Bullish Double Divergence structure.
Key Support and Resistance Levels
The structural highs and lows visible on the daily chart delineate several critical price zones:
- Major Resistance Zone (~$495.00 – $500.00): Represents the recent swing peak where price is currently testing liquidity.
- Intermediate Pivot / Support Zone (~$450.00): Former resistance area created during the preliminary decline, now acting as structural support.
- Breakout Trigger / Key Support (~$400.00): The primary neck-line zone that confirmed the structural shift from bearish to bullish.
- Major Reversal Support (~$350.00): The primary macro swing low established in late March 2026, marking the low point of the Regular Bullish Double Divergence.
Momentum Analysis
Momentum behavior provides early, high-probability warnings of structural exhaustion before price trend lines break:
- During the primary decline into late 2025 and early 2026, price continuously recorded lower lows (green trend lines on the price chart).
- Conversely, both the Short Range and Mid Range
- This dual-window agreement across both short and mid-term momentum spans demonstrates multi-timeframe momentum divergence, confirming that selling pressure was depleting despite price making new nominal lows.
Momentum Double Divergence Analysis
A Double Divergence requires a multi-point structural alignment where price forms a new extreme relative to two consecutive historical reference points, while the momentum oscillator fails to confirm the trend across both reference points.
On this chart, the Momentum Double Divergence indicator evaluates this dynamic across two lookback windows: Short range and Mid range.
Price Action:       Low 1 (Dec) ---------> Low 2 (Feb) ---------> Low 3 (Mar) [Lower Lows]
                                \                     \                     /
Short Range Oscill: Trough 1 ------------> Trough 2 ------------> Trough 3 [Higher Troughs]
Mid Range Oscill:   Trough 1 -----------------------------------> Trough 3 [Higher Troughs]
Signal-by-Signal Analysis
1. Short Range Regular Bullish Double Divergence
- Appearance: Identified across the February 2026 and March 2026 swing lows (marked with green/orange indicator lines on the upper subchart).
- Price Movement: Price dropped from the February low near $390.00 down to the March low near $350.00, forming a clear lower low.
- Indicator Movement: The Short Range Momentum Double Divergence oscillator formed a higher low over the same interval (moving from approximately -50.00 up toward -11.68).
- Signal Type:Regular Bullish Double Divergence.
- Structural Context: Demonstrates short-term selling exhaustion during the final capitulation phase of the downtrend.
- Subsequent Behavior: Shortly after this signal printed, downside price action halted near $350.00, leading directly to a sharp green candle impulse.
2. Mid Range Regular Bullish Double Divergence
- Appearance: Spans from the December 2025 low through the February 2026 low to the late March 2026 low (marked with green/orange indicator lines on the lower subchart).
- Price Movement: Price trended lower across three distinct macro troughs: December 2025 (~$425.00), February 2026 (~$390.00), and March 2026 (~$350.00), printing three progressively lower price bottoms.
- Indicator Movement: The Mid Range Momentum Double Divergence oscillator printed higher troughs across both historical reference points (holding well above the December baseline trough and curving upward through March to +13.35).
- Signal Type:Regular Bullish Double Divergence.
- Structural Context: Confirms macro momentum exhaustion. While bear pressure drove price to deeper lows, the broader momentum profile contracted significantly, indicating a major trend reversal was developing.
- Subsequent Behavior: Triggered a multi-month bullish expansion, driving price from $350.00 up past $495.00.
Confirmation
A divergence signal highlights potential trend exhaustion, but price structure must confirm the setup before a reliable transition is established:
- Candlestick Confirmation: Strong, green Heikin-Ashi candles immediately following the late March low signaled immediate buying absorption.
- Pivot Breakout Confirmation: Price decisively breached the intermediate structural pivot level at $400.00, confirming that buyers took structural control from sellers.
- Indicator Zero-Line Crossover: Both short-range and mid-range oscillators surged back into positive territory above the zero baseline line during April, confirming expanding bullish momentum.
Technical Scenarios
Bullish Scenario
- Condition: Price maintains structure above the $450.00 support level on any short-term pullbacks.
- Target/Expectation: A sustained consolidation or breakout above $495.38 would open the way toward psychological levels at $510.00+.
Bearish Scenario
- Condition: A rejection at $495.38 followed by a breakdown below the $450.00 structural support zone.
- Target/Expectation: Could prompt a deeper pullback toward the $400.00 pivot area to retest former breakout resistance as support.
Neutral / Consolidation Scenario
- Condition: Price fluctuates within a tight band between $450.00 and $495.00.
- Target/Expectation: Allows subchart momentum indicators to normalize while price absorbs overhead supply before establishing its next directional leg.
Risk and Invalidation
- Signal Invalidation Level: A daily close below the late March 2026 swing low at $350.00.
- Structural Invalidation: If price breaks below $350.00, the Regular Bullish Double Divergence structure would be invalidated, signaling that sellers have resumed control of the macro trend.
Key Levels Summary
| Level / Zone | Role | Technical Significance |
| $495.38 – $500.00 | Major Resistance | Current swing high and primary overhead target zone. |
| $450.00 | Intermediate Support | Former resistance pivot turned structural support zone. |
| $400.00 | Key Structural Support | Major neckline breakout level for the trend reversal structure. |
| $350.00 | Invalidation / Major Low | Macro double divergence low; breaking this invalidates the bullish thesis. |
Technical Outlook
MSFT presents a classic structural reversal driven by multi-range Regular Bullish Double Divergence. While price printed three progressively lower lows between December 2025 and March 2026, both the short-range and mid-range momentum metrics printed higher troughs.
The subsequent price action confirmed this exhaustion signal with an aggressive breakout above $400.00 and $450.00. The current bullish outlook remains valid while price holds above $450.00, with $350.00 serving as the ultimate macro invalidation point.
Educational Conclusion
This MSFT daily chart provides an excellent real-world example of how Double Divergence improves upon single-point divergence analysis:
- Single Divergence Risk: Standard divergence can trigger prematurely during powerful trends, leading traders into counter-trend entries while the trend continues.
- Double Divergence Advantage: By requiring price to make a new extreme relative to two consecutive historical reference points, Double Divergence filters out premature signals and verifies multi-timeframe momentum exhaustion.
- Holistic Analysis: Always pair indicator signals with price confirmation (such as pivot breakouts, candlestick patterns, and support/resistance shifts). Never trade indicator signals in isolation; use them as exhaustion markers to anticipate structural price changes.
Frequently Asked Questions
What is the difference between Short Range and Mid Range Double Divergence?
Short Range Double Divergence evaluates momentum across recent swing points (short-term pullbacks), while Mid Range Double Divergence evaluates momentum over a broader multi-month period. When both ranges align, as seen on this MSFT chart, the reliability of the reversal setup increases significantly.
How did price confirm the Bullish Double Divergence on MSFT?
Initial confirmation came from bullish Heikin-Ashi candlestick prints at the $350.00 low, followed by structural confirmation when price broke above the $400.00 resistance pivot and both momentum subcharts crossed above their zero baselines.
What price level invalidates this bullish thesis?
A decisive move and daily close below the major swing low near $350.00 would invalidate the Regular Bullish Double Divergence and signal potential continuation of the original downtrend.
Looking for the complete mathematical breakdown, step-by-step optimization guides, and advanced trading strategies? Explore our comprehensive documentation:
Visit the Technical Inputs Manual: Double Divergence Pro for full parameter tuning.
Read the master guide on the Double Divergence Indicator Series.