Directional Movement Analysis for Structured Trading Workflows
Price can continue moving in one direction even as the underlying balance between buyers and sellers begins to change. For systematic traders, identifying this change in directional pressure can provide valuable information when evaluating trend quality, continuation, and potential market transitions.
DMI Double Divergence Pro for MultiCharts combines the Directional Movement Index (DMI) with the PatternSmart Double Divergence methodology to provide a structured way to examine the relationship between price movement and directional pressure.
Designed for the MultiCharts environment, it fits naturally into systematic analysis, strategy development, backtesting, and structured trading workflows.
[Learn More / Get DMI Double Divergence Pro]
Why Directional Movement Matters
Many technical indicators focus primarily on momentum or price acceleration. DMI approaches the market from a different perspective.
The Directional Movement Index evaluates the relative strength of upward and downward directional movement through Positive Directional Indicator (+DI) and Negative Directional Indicator (-DI).
This provides an important analytical distinction: DMI is concerned not simply with whether price is moving, but with which side of the market is demonstrating greater directional control.
When price and directional movement remain aligned, the prevailing trend may continue to demonstrate directional conviction. When price continues advancing or declining while directional pressure begins to weaken, the relationship deserves closer examination.
DMI Double Divergence is designed around precisely this type of analysis.
A Different Perspective on Divergence
Traditional divergence compares price with an indicator and looks for disagreement between the two.
The PatternSmart Double Divergence methodology takes a confirmation-based approach. Rather than treating the first indication of divergence as a prediction of what price will do next, it evaluates whether the developing disagreement provides meaningful additional evidence about current market conditions.
With DMI, this means examining whether directional dominance remains aligned with price movement or whether the prevailing side of the market is gradually losing influence.
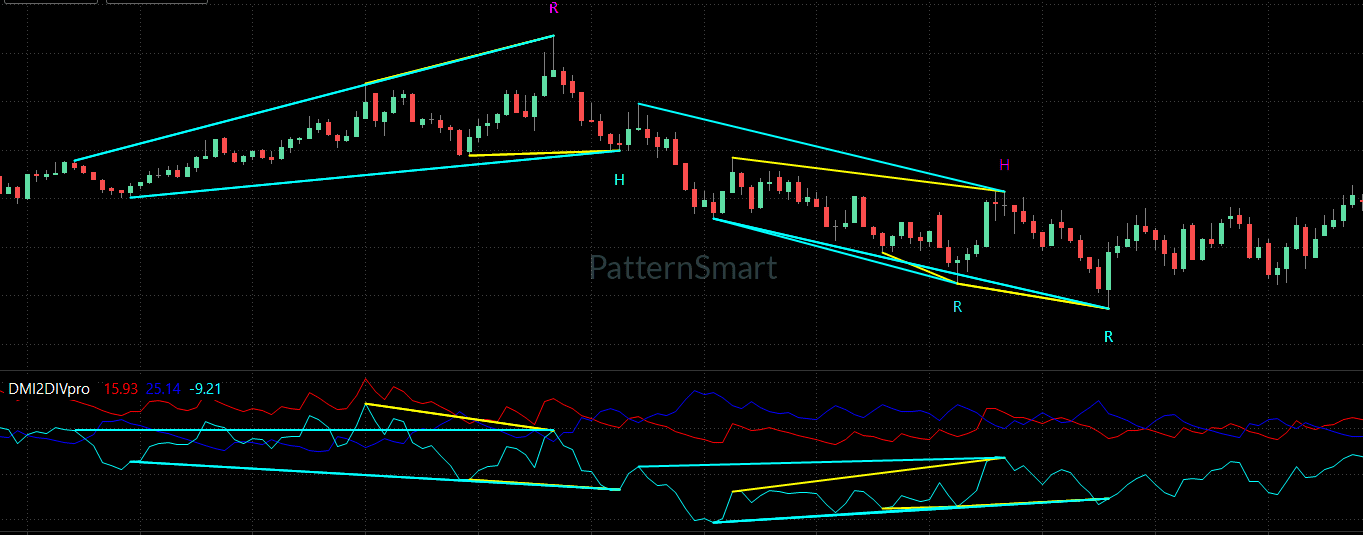
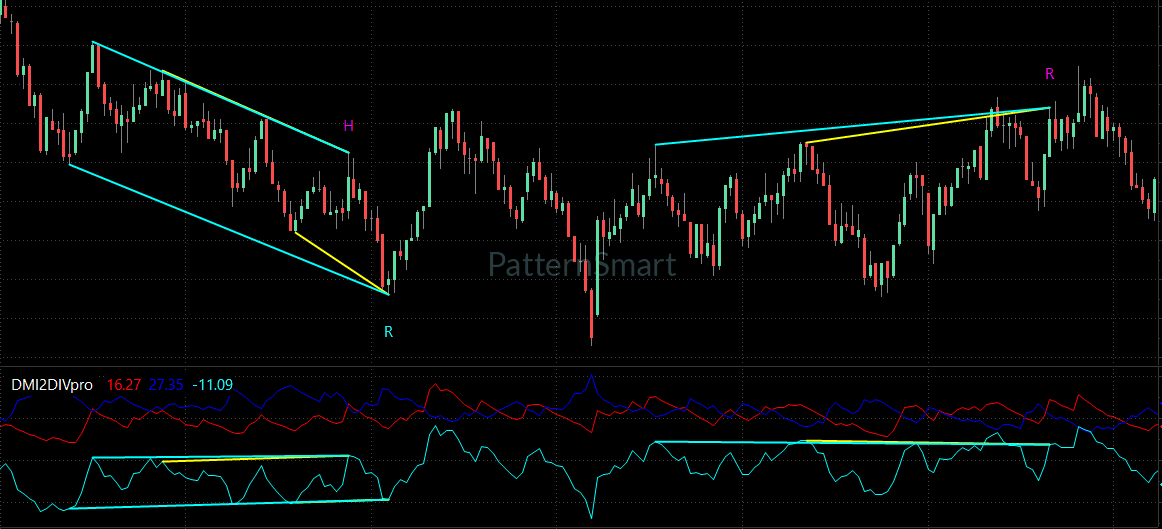
A Bullish Regular Divergence may indicate that bearish directional control is weakening while price continues making lower lows.
A Bearish Regular Divergence may indicate that bullish directional control is fading while price continues making higher highs.
These observations do not guarantee a reversal. They represent additional analytical information that should be evaluated alongside price action, market structure, and other technical evidence.
Double Divergence: Confirmation Before Prediction
The central philosophy of PatternSmart Double Divergence is simple:
Analysis → Interpretation → Confirmation → Decision
The objective is not to predict the market with certainty. Financial markets remain probabilistic, and divergence should therefore be treated as information rather than a guaranteed outcome.
DMI is particularly suitable for this approach because it provides a directional perspective that complements price analysis.
Instead of asking only:
“Is price still rising?”
a trader can also ask:
“Is bullish directional control still developing with the price movement?”
That distinction can be useful when analyzing established trends, breakout environments, and directional markets.
The methodology therefore emphasizes the quality and context of the observation rather than simply maximizing signal frequency.
Built for DMI-Based Trend Analysis
DMI Double Divergence Pro focuses on four closely related analytical concepts:
Directional Movement
DMI evaluates upward and downward directional movement, helping traders examine the balance between bullish and bearish pressure.
Trend Confirmation
When directional movement supports the broader price structure, it can provide additional confirmation for trend analysis.
Trend Quality
A trend can continue producing new highs or lows while its underlying directional conviction changes. DMI divergence helps bring this relationship into focus.
Directional Bias
Because DMI distinguishes between positive and negative directional movement, it provides a direct perspective on which side of the market is exerting greater directional influence.
These characteristics make DMI Double Divergence particularly relevant to trend-following, breakout, and position-oriented analysis.
Regular and Hidden Divergence
DMI Double Divergence supports the broader PatternSmart framework of divergence classification.
The four official signal categories are:
- Bullish Regular Divergence
- Bearish Regular Divergence
- Bullish Hidden Divergence
- Bearish Hidden Divergence
Regular divergence can help identify situations where the existing directional movement is losing alignment with price.
Hidden divergence can provide additional information when evaluating continuation within an established market structure.
The important point is that neither category should be interpreted independently of market context. Signal classification organizes the technical observation; confirmation and broader analysis determine how that observation should be interpreted.
Professional Configuration Without Changing the Methodology
DMI Double Divergence Pro provides configurable inputs that allow the indicator to adapt to different analytical workflows without changing the underlying Double Divergence methodology.
Signal Generation
The indicator provides controls for:
- Wait 1 Bar
- Show Regular Bullish
- Show Regular Bearish
- Show Hidden Bullish
- Show Hidden Bearish
These settings determine which divergence types are evaluated and how signal confirmation is handled.
Structural Analysis
The Advanced Parameters include:
- Divergence Bar Range
- Divergence Lookback
- Filter Length
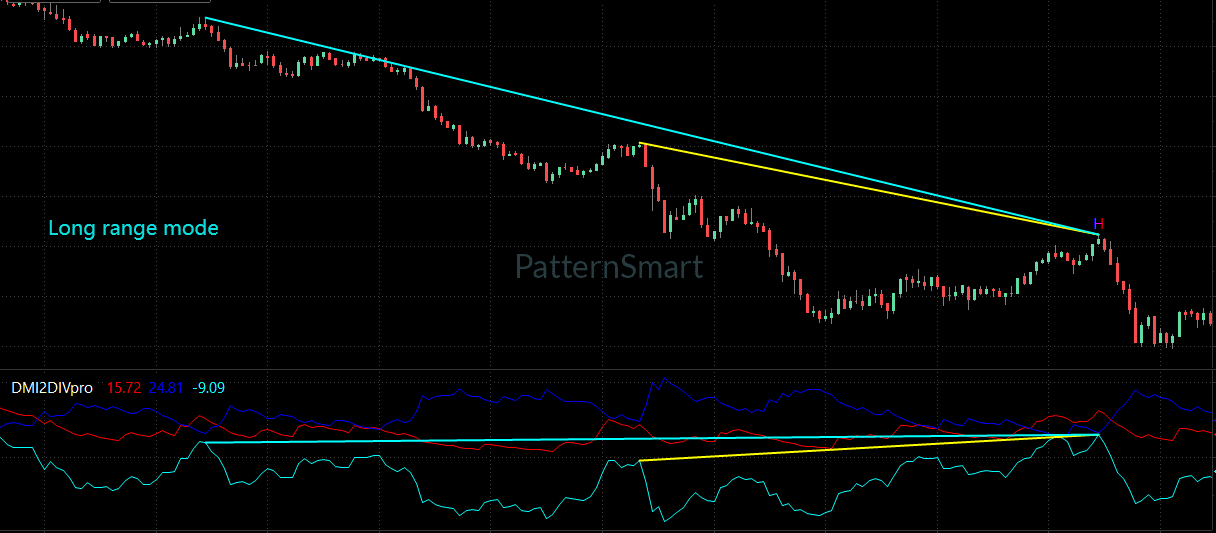
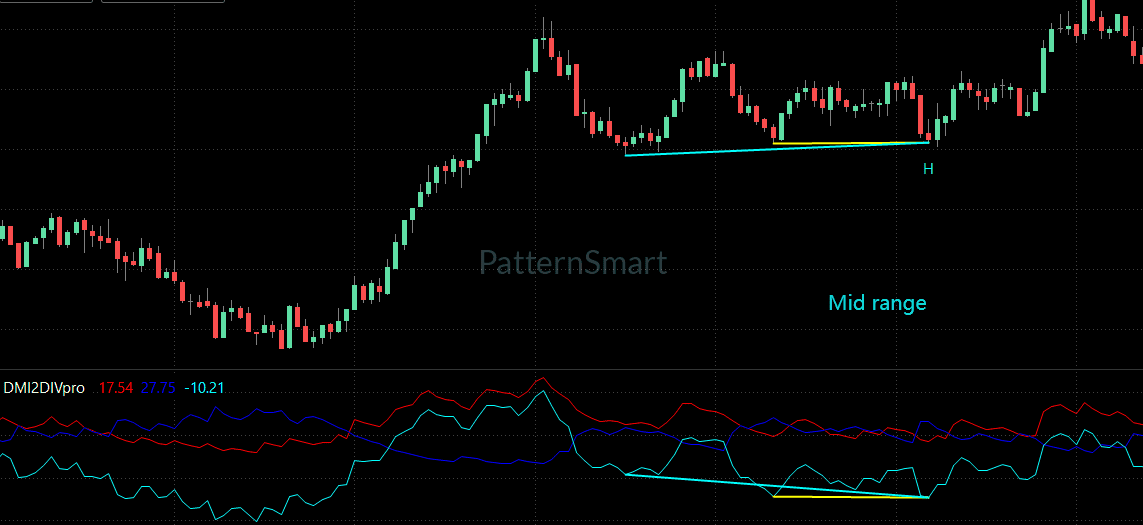
Divergence Bar Range defines the structural search scope between potential divergence anchor points. ShortRange focuses on relatively compact structures, while MidRange and LongRange allow progressively broader structural relationships to be evaluated.
Divergence Lookback controls the historical bars considered when identifying local swing highs and lows.
Filter Length controls internal smoothing during structural evaluation. Higher values produce smoother structural evaluation, while lower values produce more responsive evaluation.
These parameters affect structural evaluation and signal behavior; they do not change what the Double Divergence methodology represents.
Enhanced Mode
Enhanced Mode provides additional structural filtering before a signal is confirmed. It is designed as a quality-control mechanism rather than as a separate trading strategy.
Alerts
Enable Alert and Alert Sound provide notification functionality for confirmed signals. Alert settings communicate confirmed signals but do not determine whether a signal exists.
Chart Presentation
For structured chart analysis, the indicator also provides:
- Show Char
- Show Line
- Only Show Last Signal Within Bars
- Price Line Brush
- Price Line Dash Style
- Price Line Width
These settings control presentation rather than signal calculation.
DMI Double Divergence Pro in MultiCharts
MultiCharts is designed for traders who work with systematic analysis, strategy development, backtesting, optimization, and portfolio-level evaluation.
That environment provides a natural setting for incorporating structured divergence analysis into a broader analytical workflow.
DMI Double Divergence can serve as an additional source of technical information when developing and evaluating systematic concepts. Its directional-movement perspective can complement other market measurements while maintaining the same Double Divergence methodology used throughout the PatternSmart product family.
The platform changes the workflow—not the methodology.
Whether the indicator is used during research, chart analysis, strategy development, or broader portfolio evaluation, the underlying interpretation of Double Divergence remains consistent.
From Signal Detection to Structured Analysis
A useful way to approach DMI Double Divergence is to treat each signal as the beginning of an analytical process rather than the end.
When a divergence appears, consider:
- What is price doing?
- What is directional movement doing?
- Is bullish or bearish control strengthening or weakening?
- What does the broader market structure indicate?
- Is there additional technical confirmation?
- Does the observation support the current analytical thesis?
This process reflects the PatternSmart philosophy of confirmation before prediction.
The indicator provides evidence. The trader evaluates that evidence within the larger market context.
Key Benefits
DMI Double Divergence Pro for MultiCharts can help traders:
- Evaluate directional movement alongside price action
- Examine changes in bullish and bearish directional control
- Analyze trend quality from a directional perspective
- Identify potential weakening of directional conviction
- Study trend continuation through Hidden Divergence
- Incorporate structured divergence analysis into MultiCharts workflows
- Adjust structural evaluation through documented configuration options
- Organize confirmed signals visually for clearer chart analysis
These benefits are analytical rather than predictive. No divergence signal guarantees a reversal, continuation, or profitable result.
Who Is DMI Double Divergence Pro For?
DMI Double Divergence Pro for MultiCharts is particularly relevant to:
- Systematic traders
- Strategy developers
- Quantitative traders
- Professional technical analysts
- Trend-following traders
- Breakout-oriented analysts
- Traders studying directional market structure
It is especially useful for analysts who want to examine directional pressure and market control rather than relying exclusively on conventional momentum analysis.
Frequently Asked Questions
What is DMI Double Divergence?
DMI Double Divergence combines the Directional Movement Index with the PatternSmart Double Divergence confirmation methodology. It evaluates the relationship between price movement and directional dominance to identify situations where directional pressure may be changing.
What is the difference between DMI and ADX?
DMI focuses on directional movement and the relative influence of bullish and bearish pressure. ADX focuses primarily on overall trend strength. They therefore provide different analytical perspectives.
Does DMI Double Divergence predict reversals?
No. Divergence represents analytical information rather than a guaranteed prediction. A potential reversal interpretation should be supported by price action, market structure, and additional confirmation.
Can DMI Double Divergence be used for trend continuation analysis?
Yes. Hidden divergence can provide information relevant to continuation analysis, particularly when evaluated within an established market structure.
Is DMI Double Divergence suitable for MultiCharts strategy development?
The product is designed for the MultiCharts environment, whose typical workflow includes systematic analysis, strategy development, backtesting, and portfolio evaluation. DMI Double Divergence can therefore be incorporated as an analytical component within broader structured workflows.
Can the signal behavior be configured?
Yes. Documented configuration options include signal-generation controls, Enhanced Mode, Divergence Bar Range, Divergence Lookback, Filter Length, alert settings, and visualization controls.
Do the settings change the Double Divergence methodology?
No. Configuration changes software behavior such as structural evaluation, signal frequency, confirmation, or presentation. The underlying Double Divergence methodology remains unchanged.
Bring Directional Movement Analysis to MultiCharts
DMI Double Divergence Pro provides a structured way to examine one of the most important questions in trend analysis:
Is directional pressure still supporting the price movement?
By combining DMI’s directional perspective with PatternSmart’s confirmation-based Double Divergence methodology, traders can evaluate changes in market control with greater analytical structure.
For MultiCharts users, this creates a natural addition to a systematic and disciplined technical analysis workflow.
Explore DMI Double Divergence Pro for MultiCharts and incorporate directional divergence analysis into your professional trading research.
[Get Started With DMI Double Divergence Pro for MultiCharts]
Looking for the complete mathematical breakdown, step-by-step optimization guides, and advanced trading strategies? Explore our comprehensive documentation:
Visit the Technical Inputs Manual: Double Divergence Pro for full parameter tuning.
Read the master guide on the Double Divergence Indicator Series.