Identify Four Types of CCI Double Divergence on Your MultiCharts Charts
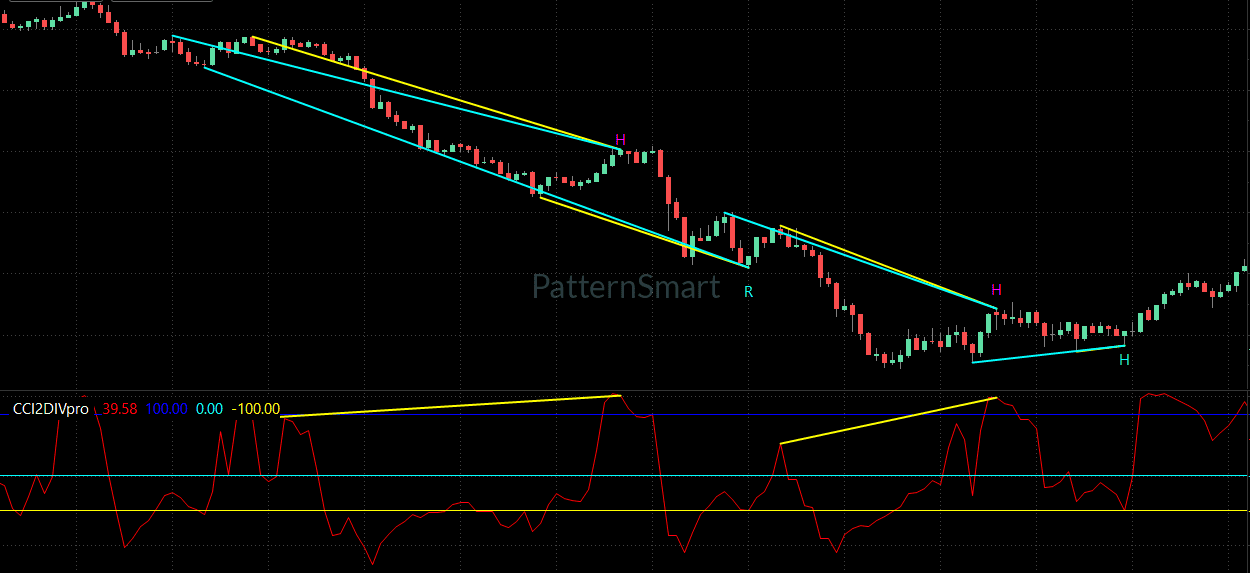
CCI Double Divergence Pro for MultiCharts is a specialized technical analysis indicator designed to help traders identify regular bullish, hidden bullish, regular bearish, and hidden bearish double divergence using the Commodity Channel Index (CCI) alongside price behavior.
Instead of requiring traders to manually compare multiple price swings with corresponding CCI movements, the indicator presents potential divergence relationships directly on the chart through visual markers and connecting lines.
With configurable divergence ranges, signal visibility, confirmation behavior, alerts, and chart-display controls, traders can adapt the indicator to different analytical approaches and market conditions.
[Get CCI Double Divergence Pro]
Turn Complex Divergence Analysis Into a Structured Chart View
Divergence can be valuable, but manually identifying meaningful relationships between price swings and an oscillator can be time-consuming and subjective.
CCI Double Divergence Pro provides a structured way to examine these relationships.
| Common Trading Challenge | How CCI Double Divergence Pro Helps |
|---|---|
| Difficult to compare several price swings manually | Highlights double-divergence relationships visually |
| Regular and hidden divergence can be easy to confuse | Separates four divergence categories |
| Divergence can occur over different swing ranges | Provides Short, Mid, and Long divergence range modes |
| Too many historical signals can clutter a chart | Allows recent-signal display control |
| Visual confirmation can require repeated chart inspection | Optional signal markers and divergence lines make relationships easier to review |
The objective is not to replace market analysis, but to make an important part of that analysis more structured and visible.
Key Features
1. Four Double-Divergence Signal Types
CCI Double Divergence Pro can display four distinct signal categories:
- Regular Bullish Divergence
- Hidden Bullish Divergence
- Regular Bearish Divergence
- Hidden Bearish Divergence
Each represents a different relationship between price behavior and CCI behavior.
Why It Matters
Regular and hidden divergence can serve different analytical purposes. Having both available allows traders to examine potential momentum shifts as well as divergence occurring within an existing market movement.
How Traders Can Use It
A trader can enable or disable each divergence category independently, making it possible to focus only on the signal types relevant to a particular methodology.
2. Double-Divergence Visualization
When a qualifying divergence is identified, the indicator can draw visual connections between the relevant price points and corresponding CCI points.
This creates a direct visual relationship between:
Price Structure → CCI Structure → Divergence
Why It Matters
Rather than relying only on a label or isolated signal marker, traders can visually inspect the relationship that produced the divergence indication.
How Traders Can Use It
Use the connecting lines as an analytical aid, then evaluate the signal against trend direction, support and resistance, price action, and other market-context information.
3. Short, Mid & Long Divergence Ranges
The indicator provides three divergence-range modes:
- Short Range
- Mid Range
- Long Range
These modes allow the trader to control the general swing range used for divergence analysis.
Why It Matters
Different trading styles may require different levels of market structure.
A shorter range can be useful when examining relatively nearby swings, while longer ranges can help traders investigate broader price and momentum relationships.
The appropriate choice depends on the instrument, timeframe, and trading approach.
4. Optional Signal Confirmation
CCI Double Divergence Pro includes an optional waiting/confirmation behavior that can delay the displayed signal by one bar and incorporate the direction of the signal bar into confirmation.
Why It Matters
Some traders prefer to evaluate a divergence only after additional price information becomes available rather than reacting immediately to an emerging condition.
How Traders Can Use It
Traders can enable or disable this behavior according to their preferred balance between earlier identification and additional confirmation.
5. Enhanced Mode
An optional Enhanced Mode provides an additional structural filter for divergence identification.
This gives traders another way to control the strictness of the divergence analysis without exposing or requiring knowledge of the underlying implementation.
What You Actually See on the Chart
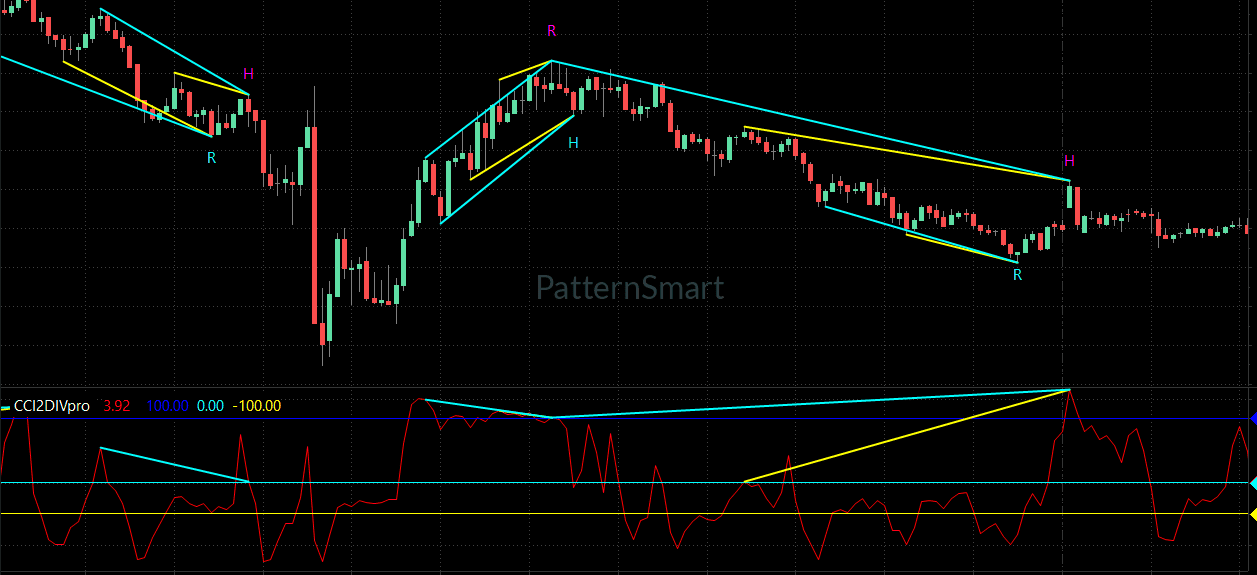
CCI Double Divergence Pro presents the CCI in its indicator panel together with reference levels for:
- Upper Line
- Middle Line
- Lower Line
The default reference levels are 100, 0, and -100, respectively, and can be adjusted.
When divergence is identified, the indicator can display:
- R markers for regular divergence
- H markers for hidden divergence
- Connecting lines on the price chart
- Corresponding connecting lines within the CCI panel
- Different visual colors for bullish and bearish divergence
- Optional alerts when a signal occurs on the latest chart bar
The result is a chart view where the trader can see both the price relationship and the corresponding CCI relationship rather than having to interpret the oscillator independently.
How CCI Double Divergence Works
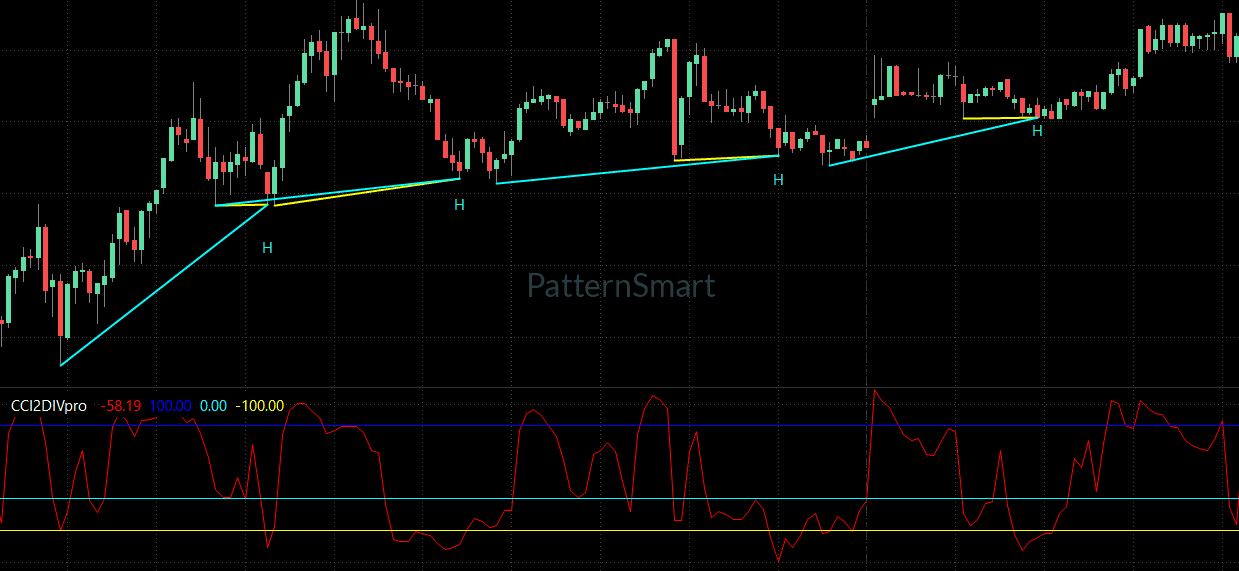
At a high level, the indicator follows a straightforward analytical concept:
1. Observe Price
The indicator examines significant price swing areas within the selected divergence range.
2. Compare CCI Behavior
CCI behavior around those price structures is evaluated for a contrasting relationship.
3. Look Beyond a Single Swing
The product is designed specifically around double divergence, using multiple swing relationships rather than treating every isolated oscillator difference as a signal.
4. Classify the Divergence
A qualifying relationship can be classified as:
- Regular bullish
- Hidden bullish
- Regular bearish
- Hidden bearish
5. Present the Relationship Visually
The resulting divergence can be represented with markers and connecting lines, allowing the trader to inspect the setup in the context of the broader chart.
The indicator therefore functions as a divergence-analysis and decision-support tool, not as an automatic trading system.
Regular vs. Hidden Divergence
Understanding the distinction is important when using CCI Double Divergence Pro.
Regular Bullish Divergence
A regular bullish divergence represents a situation where price and CCI develop a contrasting relationship that can draw attention to a potential change in downside momentum.
Hidden Bullish Divergence
Hidden bullish divergence represents a different relationship between price and CCI that can be useful when analyzing bullish continuation or strength within an existing move.
Regular Bearish Divergence
Regular bearish divergence highlights a contrasting price/CCI relationship that can draw attention to potential weakening of upside momentum.
Hidden Bearish Divergence
Hidden bearish divergence provides another type of bearish price/CCI relationship that can be considered when evaluating continuation or weakness within a broader market movement.
Important: A divergence signal is an analytical observation—not a guarantee that price will reverse or continue.
Practical Trading Workflow
A disciplined workflow can help prevent divergence signals from being interpreted in isolation.
Long-Side Analysis
A trader might consider:
Bullish Double Divergence → Market Context → Price Confirmation → Risk Management
For example, after a bullish divergence appears, the trader can examine whether price is approaching an important support area, whether the broader trend supports the interpretation, and whether subsequent price action provides confirmation.
Short-Side Analysis
A similar framework can be used:
Bearish Double Divergence → Market Context → Price Confirmation → Risk Management
A bearish divergence can be evaluated alongside resistance, trend conditions, price behavior, and subsequent confirmation before considering an entry.
The indicator does not determine the appropriate entry, stop-loss, or position size. Those decisions remain part of the trader’s broader methodology.
Confirmation & Market Context
CCI Double Divergence Pro is most useful when its signals are interpreted within a broader technical-analysis framework.
Consider combining divergence observations with relevant evidence such as:
- Current trend direction
- Support and resistance
- Price structure
- Candlestick behavior
- Breakouts or failed breakouts
- Higher-timeframe context
- Volatility and market conditions
A practical framework is:
Signal → Context → Confirmation → Risk Management
This approach helps distinguish between simply seeing divergence and understanding what that divergence means within the current market environment.
Timeframes & Markets
The implementation does not restrict the indicator to a specific asset class or timeframe.
As a CCI-based divergence tool, it can be incorporated into technical analysis across instruments available through MultiCharts.
However, divergence characteristics can change significantly with:
- Timeframe
- Instrument volatility
- Trading style
- Swing structure
- Market regime
The available range and CCI settings give traders flexibility to adapt the indicator to their preferred analytical environment rather than relying on a single universal configuration.
Customization for Different Trading Styles
CCI Double Divergence Pro exposes a substantial set of user controls.
Traders can configure:
Signal Visibility
Choose whether to display regular or hidden bullish and bearish divergence.
CCI Settings
Adjust the CCI period and related analysis settings.
Divergence Range
Choose Short, Mid, or Long range analysis.
Swing Analysis
Control the lookback characteristics used for identifying relevant market structures.
Signal Display
Enable or disable:
- Signal characters
- Divergence lines
- Alerts
Chart Appearance
Customize divergence line colors, width, and style.
Historical Signal Display
Control how closely spaced signals are visually retained, helping manage chart clutter.
This makes the indicator suitable for traders who want to tailor the visual presentation and analytical sensitivity to their own workflow.
Why Use Double Divergence Instead of Looking at CCI Alone?
A conventional CCI analysis often focuses on oscillator levels, crossings, or movement around reference areas.
Divergence analysis asks a different question:
Is price behaving differently from the underlying CCI movement?
Double divergence takes that concept further by examining relationships across multiple swing structures.
That gives traders another perspective on momentum and price behavior without requiring them to abandon their existing price-action or trend-analysis methods.
Who Is CCI Double Divergence Pro For?
CCI Double Divergence Pro is particularly suited to:
Intermediate Traders
Traders who already understand CCI and want a more structured way to study divergence.
Advanced Technical Analysts
Traders who use divergence as one component of a broader market-analysis methodology.
Day Traders
Those who want to monitor shorter-term price/CCI relationships.
Swing Traders
Those who prefer examining broader market swings and longer-range divergence structures.
It is less appropriate for someone looking for a completely automated “buy/sell” system without learning how divergence and market context should be interpreted.
CCI Double Divergence Pro for MultiCharts
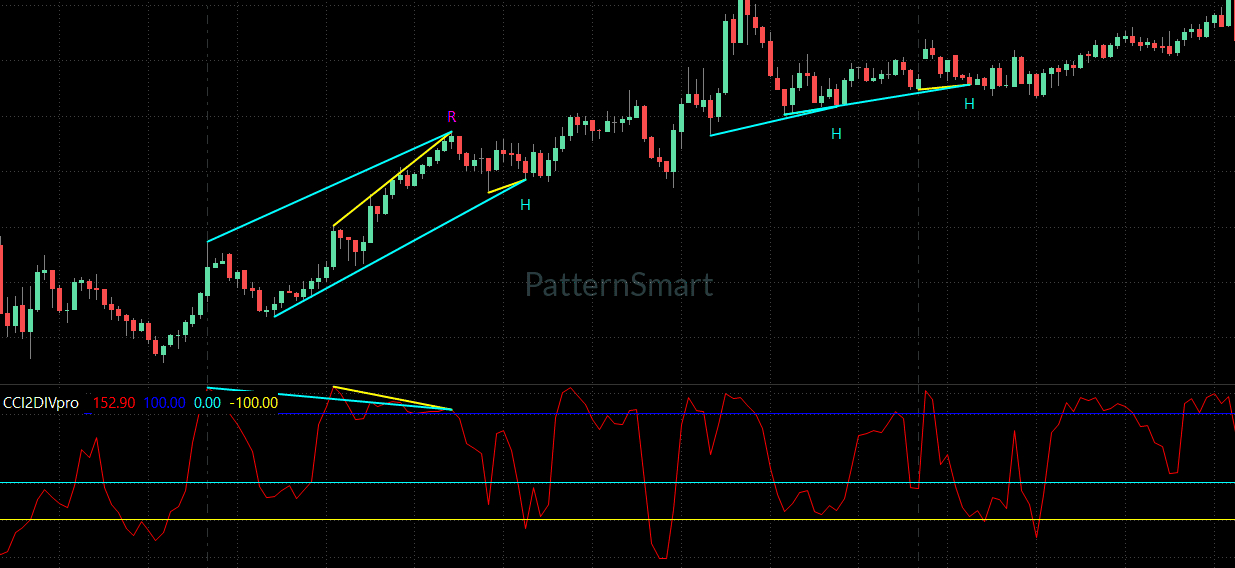
MultiCharts provides the charting environment in which CCI Double Divergence Pro presents its price and oscillator analysis.
The indicator is designed specifically for the MultiCharts platform, allowing traders to incorporate CCI double-divergence analysis directly into their existing MultiCharts technical-analysis workflow.
The emphasis is on visual analysis: identify the divergence, inspect the underlying price structure, and then evaluate the signal within the trader’s broader methodology.
FAQ
Is CCI Double Divergence Pro suitable for beginners?
It can be used by developing traders, but a basic understanding of CCI, divergence, price structure, and technical analysis is recommended. Intermediate traders will generally get more value from its four divergence classifications and configurable analysis ranges.
What types of divergence does it identify?
The indicator identifies four categories: regular bullish, hidden bullish, regular bearish, and hidden bearish divergence.
Does the indicator repaint?
The supplied implementation includes specific confirmation behavior and historical swing analysis, so an unconditional “no repaint” claim is not appropriate. Traders should understand how the optional waiting behavior affects signal confirmation.
Can I customize which divergence signals are displayed?
Yes. Regular and hidden bullish and bearish divergence can each be independently enabled or disabled.
Can I customize the divergence range?
Yes. The indicator provides Short Range, Mid Range, and Long Range modes.
Does it provide alerts?
Yes. The implementation includes an optional alert function for signals occurring on the latest chart bar.
Can I change the appearance of divergence lines?
Yes. Traders can customize line colors, width, and style, as well as choose whether divergence lines and signal characters are displayed.
Is CCI Double Divergence Pro an automated trading strategy?
No. It is an indicator designed to support technical analysis. Divergence signals should be evaluated alongside market context, confirmation, and appropriate risk management.
See CCI Double Divergence Directly on Your MultiCharts Charts
CCI Double Divergence Pro provides a structured way to study the relationship between price swings and CCI behavior.
With four divergence classifications, configurable analysis ranges, optional confirmation, visual divergence lines, signal markers, alerts, and presentation controls, it can become a practical component of a broader technical-analysis workflow.
[Get Started With CCI Double Divergence Pro for MultiCharts]
Looking for the complete mathematical breakdown, step-by-step optimization guides, and advanced trading strategies? Explore our comprehensive documentation:
Visit the Technical Inputs Manual: Double Divergence Pro for full parameter tuning.
Read the master guide on the Double Divergence Indicator Series.