In technical analysis, few tools match the power of a Double Divergence indicator. By identifying consecutive instances of Regular (R) and Hidden (H) divergences, these indicators give traders an edge in spotting impending trend reversals and high-probability trend continuations.
However, an indicator is only as good as its configurations. The most critical, yet frequently misunderstood, setting in any double divergence tool is the Divergence Bar Range (often labeled as lookback period, scan depth, or max bars).
While the examples below feature the DMI 2 Div Pro running on a 5-Minute Heiken-Ashi chart for ES futures inside NinjaTrader, the exact same principles apply to all double divergence indicators, whether they are based on RSI, MACD, Stochastics, or CCI.
Here is a comprehensive guide on how the Divergence Bar Range works and how to adjust it to fit your specific trading style.
What is the Divergence Bar Range Input?
The Divergence Bar Range determines the maximum number of historical bars the indicator is allowed to look back to connect swing highs or swing lows.
- Regular Divergences (R): Signal potential trend reversals (e.g., price makes a lower low, but the indicator makes a higher low).
- Hidden Divergences (H): Signal potential trend continuations (e.g., price makes a higher low in an uptrend, but the indicator makes a lower low).
By altering the bar range input, you are telling the indicator’s algorithm whether to look at the “macro” horizon, the “micro” noise, or somewhere in between.
Analyzing the Three Bar Range Environments
To understand how to adjust this setting for your chart, let’s break down the three primary ranges: Long, Mid, and Short.
1. Long Range: The Macro Structural View
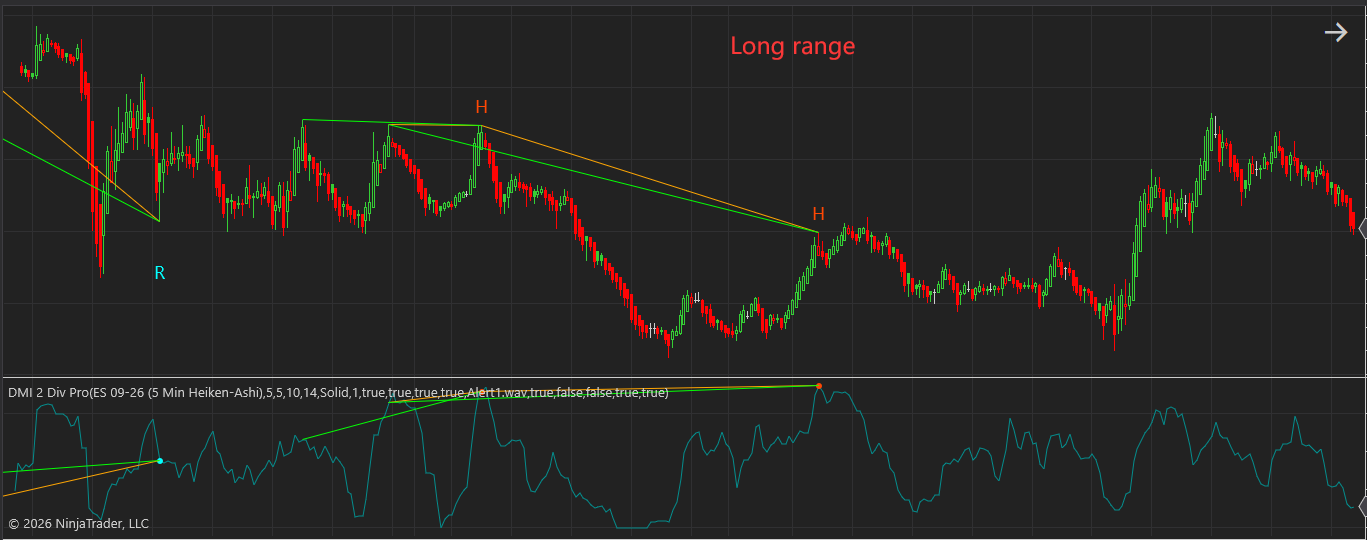
When you maximize your Divergence Bar Range, you force the indicator to ignore minor market gyrations and focus strictly on major market structure.
Long Range
- How it looks on the chart: As seen in the example, the trendlines connect peaks and troughs spanning across extensive stretches of time. Notice how the orange lines bridge major historical swings, filtering out all intermediate price fluctuations.
- Pros: Highly reliable. Signals captured at this range typically represent massive institutional shifts or major macro-trend defenses.
- Cons: Extremely low frequency. You will have to wait a long time for these setups to form, and your stop-loss might need to be wider to accommodate larger structural swings.
2. Mid Range: The Balanced Sweet Spot
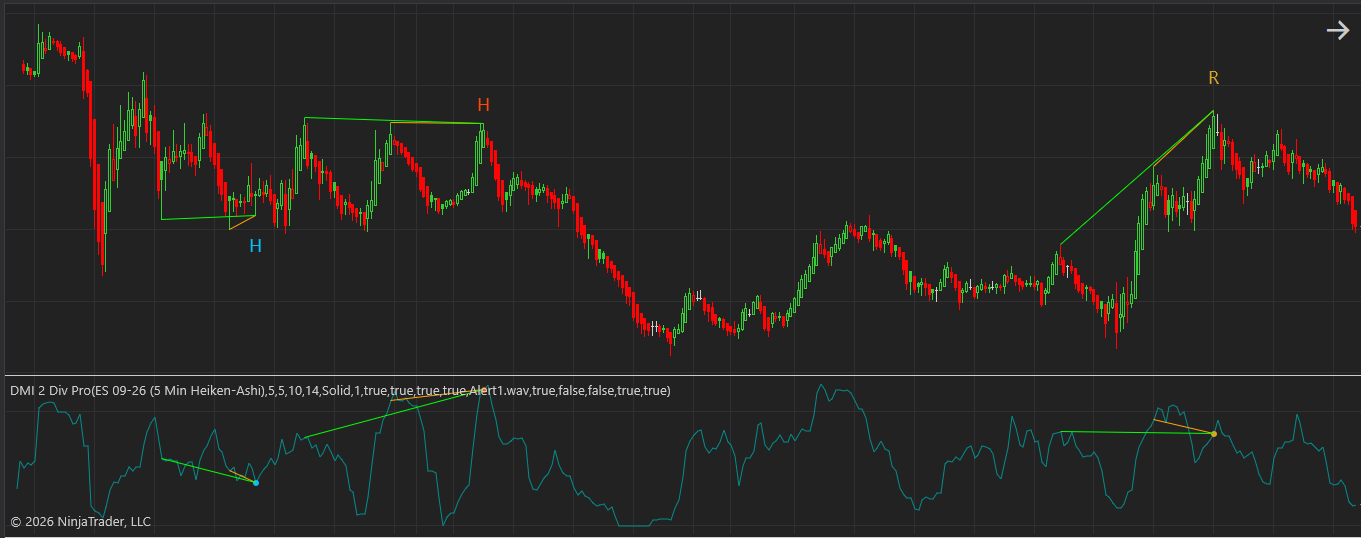
For most intraday and swing traders, the Mid Range setting offers the best compromise between reliability and opportunity.
Mid Range
- How it looks on the chart: The connections span clear, distinct market waves. It captures standard market cycles—connecting yesterday’s high to today’s high, or major session turning points—without reaching across the entire day’s data.
- Pros: Provides a healthy balance of clear trade setups with manageable risk-to-reward ratios. It easily identifies standard market structure shifts.
- Cons: Can occasionally lag during hyper-volatile market openings or get chopped up during tight, low-volume consolidation zones.
3. Short Range: The Scalper’s Micro View
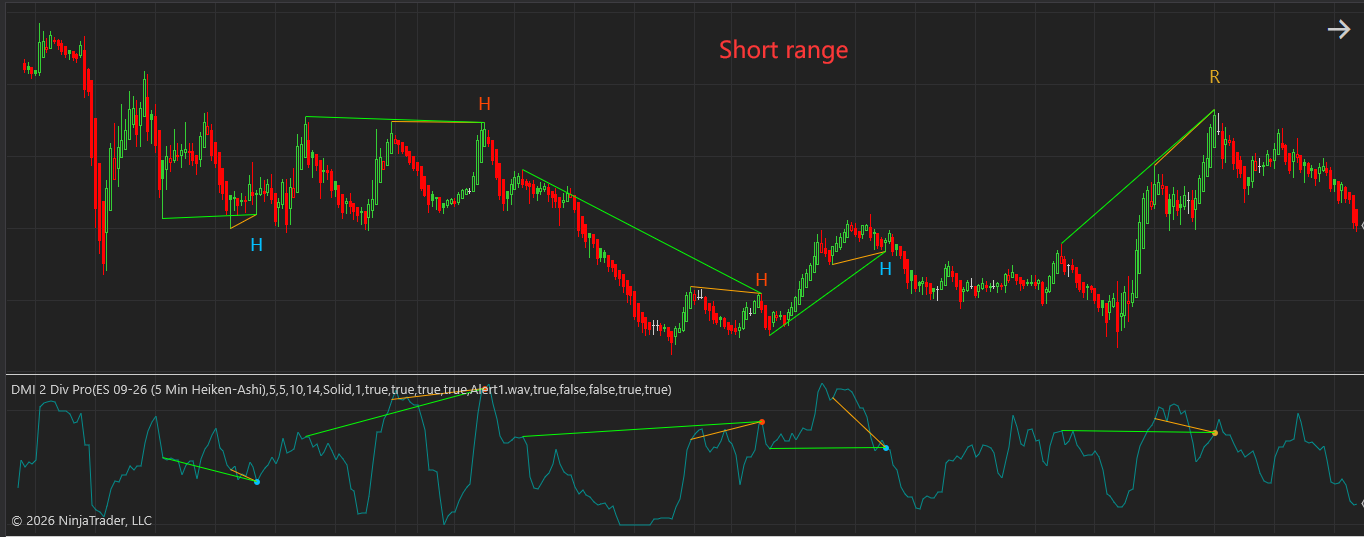
When you crank the Divergence Bar Range down to a tight, low number, the indicator focuses exclusively on immediate, back-to-back swing points.
Short Range
- How it looks on the chart: The indicator becomes highly sensitive. As shown in the short-range example, multiple localized trendlines clutter the screen, rapidly catching the tiny, consecutive retracements down in the valleys and up on the peaks.
- Pros: Abundant trading signals. Perfect for fast-paced scalpers, order-flow traders, or those trading ultra-low timeframes (like 1-minute or tick charts) looking for immediate momentum ticks.
- Cons: High noise level. You will encounter significantly more false breakouts and “fake-out” divergences if the overall market is trending heavily against you.
How to Adjust the Range to Meet Your Needs
There is no single “correct” setting for the Divergence Bar Range; your ideal input depends heavily on your trading personality, asset volatility, and style. Use the optimization matrix below to configure your tool:
| Trading Style | Recommended Bar Range | Primary Focus | Best Used For |
| Scalping / Momentum | Short (e.g., 5–15 bars) | Capturing micro-swings and immediate momentum shifts. | Quick, high-frequency entries with tight stop-losses. |
| Day Trading / Intraday Swing | Mid (e.g., 20–50 bars) | Balancing session structure with modern algorithmic cycles. | Trading standard 5-min, 15-min, or Renko trends. |
| Swing Trading / Position Trading | Long (e.g., 60–100+ bars) | Identifying major macro trend reversals and structural levels. | Daily/Hourly charts or macro index tracking (like ES/NQ). |
Golden Rules for Fine-Tuning Your Indicator:
- Match Your Chart Type: If you use smoothed bars like Heiken-Ashi (as seen in the screenshots), a slightly longer bar range prevents the indicator from getting confused by consecutive green or red blocks. For standard candlestick charts, a standard mid-range lookback keeps things orderly.
- Filter via Higher Timeframes: If you prefer using a Short Range setting to get precise entries, always use a higher-timeframe chart to ensure you are trading in the direction of the macro trend.
- Avoid Visual Overlap: If your chart becomes an illegible web of green and orange lines, your range is likely too short for the current timeframe. Bump the bar range up until the lines connect clear, visually distinct “V-shapes” in the price action.