In fast-moving financial markets, technical traders rely heavily on divergence indicators to spot potential market reversals. However, when trading volatile assets like NQ (Nasdaq 100 Futures), indicators can sometimes trigger multiple closely spaced signals as a pattern develops. This can lead to chart clutter and execution paralysis.
To solve this, advanced divergence indicators—such as the RSI Double Divergence, MACD Double Divergence, and Stochastic Double Divergence—utilize a powerful filtering parameter: “Only Show Last Signal Within Bars”.
Whether you are scalping intraday moves or swing trading macro trends, understanding how to tune this specific setting is crucial for optimizing your trading chart.
What is the “Only Show Last Signal Within Bars” Input?
The “Only Show Last Signal Within Bars” input is a proximity filter. It tells the indicator’s algorithm how to handle successive divergence signals that occur within a specified window of candlesticks (bars).
The Core Rule: If a new divergence signal appears within
Xnumber of bars of a previous signal of the same type, the indicator will evaluate them and only display the most recent (last) signal, hiding the earlier, redundant ones.Chart Logic: Operates as an automated cleanup filter that dynamically manages chart clutter. If a new double divergence signal fires within this specified number of bars from a previous signal of the same category, the system completely erases the historical lines and shapes associated with the older signal.
While the examples below feature the RSI Double Divergence indicator on an NQ chart, this exact logic applies universally across all Double Divergence indicators (CCI, MACD, Stochastic, etc.). The underlying math changes based on the oscillator used, but the signal-filtering mechanics remain identical.
Visualizing the Difference: Setting = 10 vs. Setting = 3
Adjusting this parameter drastically alters how divergence channels and labels (Regular “R” and Hidden “H”) are painted on your chart. Let’s break down the two scenarios shown in the technical chart analysis:
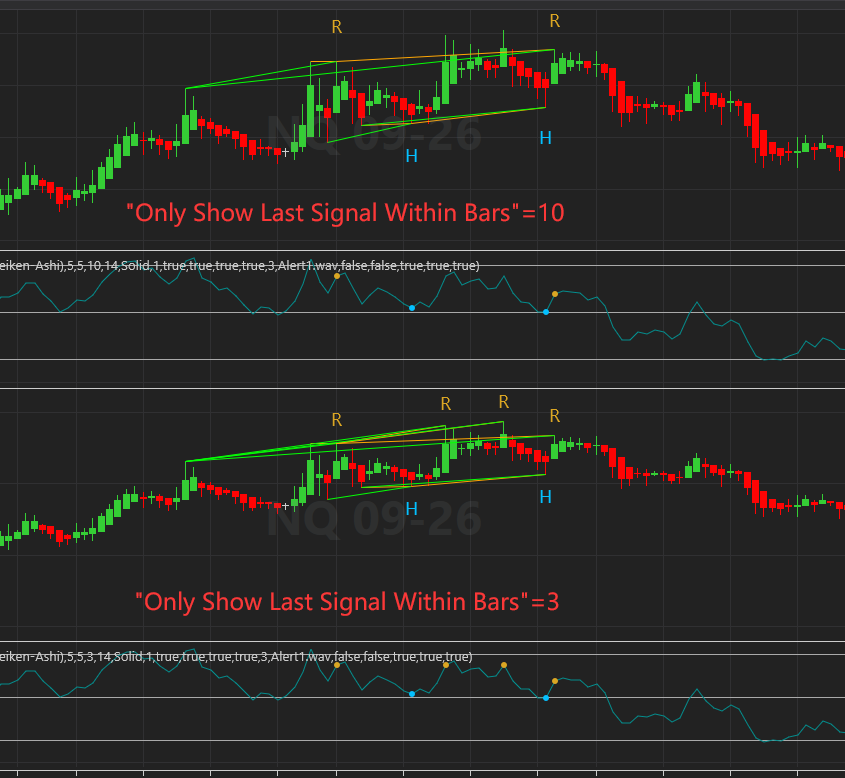
1. “Only Show Last Signal Within Bars” = 10 (Macro Filtering)
When this parameter is set to a higher value like 10, you are instructing the script to look across a wider horizon (10 bars) and filter out rapid-fire signals.
- The Result: The indicator acts more conservatively. If multiple regular divergence points form within a 10-bar window, it clears out the noise and only connects the most recent peaks/troughs.
- Chart Impact: Notice in the top panel of the image how clean the channels look. There are fewer “R” (Regular Divergence) labels because closely grouped micro-signals are collapsed into a single, cleaner macro-structure.
2. “Only Show Last Signal Within Bars” = 3 (Micro Tracking)
When you lower this parameter to a smaller value like 3, you drastically tighten the filtering window.
- The Result: The indicator becomes highly sensitive. If a divergence signal forms, and another one forms just 4 or 5 bars later, both will remain visible on the chart because they fall outside the tight 3-bar restriction window.
- Chart Impact: Look at the bottom panel of the image. You will immediately notice more “R” labels appearing on the chart. Because the indicator isn’t suppressing signals over a 10-bar lookback, it draws overlapping divergence channels, capturing micro-shifts in momentum.
How to Adjust This Input to Meet Your Trading Needs
There is no “perfect” number for this setting; it depends entirely on your trading style, time frame, and asset volatility.
| Trading Style | Recommended Value | Why It Works |
| Scalping / Intraday | 2 to 5 | Captures rapid, short-term momentum shifts. Ideal for traders who want to catch quick reversals on 1-minute or 5-minute charts and don’t mind sorting through more frequent signals. |
| Swing Trading | 8 to 15+ | Eliminates noise on 1-hour, 4-hour, or Daily charts. It ensures that you only commit to strong, sustained divergence patterns rather than minor structural retests. |
| Volatile Assets (e.g., Crypto/Tech Futures) | Higher Values | Highly volatile assets frequently form “fake-out” micro-divergences before the actual reversal happens. Higher values protect you from entering too early. |
Summary for Traders
The “Only Show Last Signal Within Bars” input is your primary tool for controlling chart clutter and signal validity across all Double Divergence tools.
- Increase the value to filter out noise, clean up your chart channels, and focus on macro reversals.
- Decrease the value to map out precise, high-frequency structural shifts and micro-entries.
By testing this parameter during your backtesting routine, you can perfectly align your Double Divergence indicators with your personal tolerance for risk and preferred market rhythm.