Price can be up trend and downtrend simultaneously in different timeframes.
Experienced traders know the importance of looking at Multiple Time Frames.
Analyzing multi time frame chart allows trader to have a greater view on the price action.
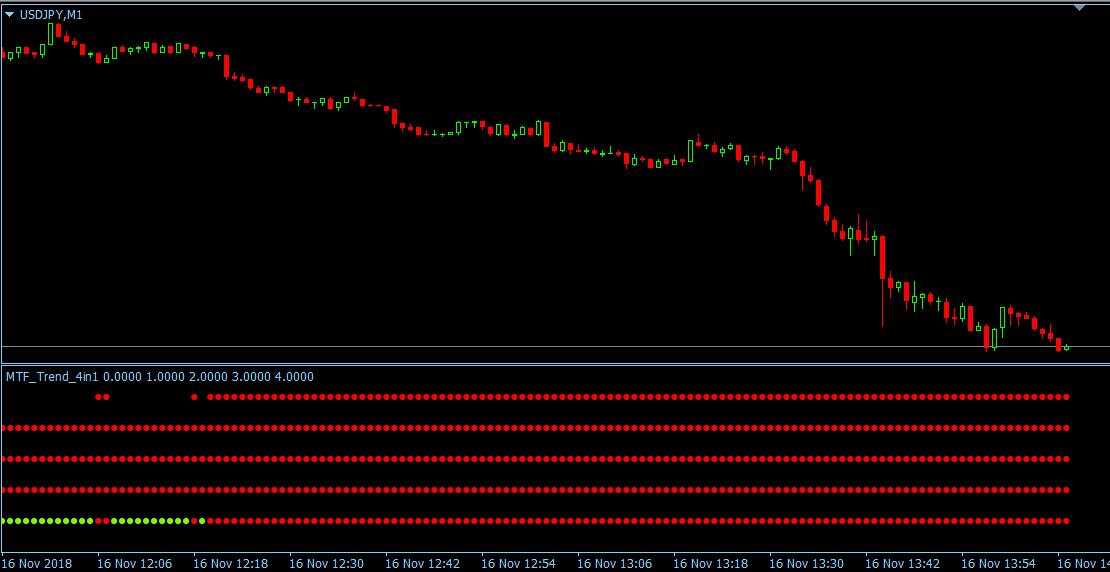
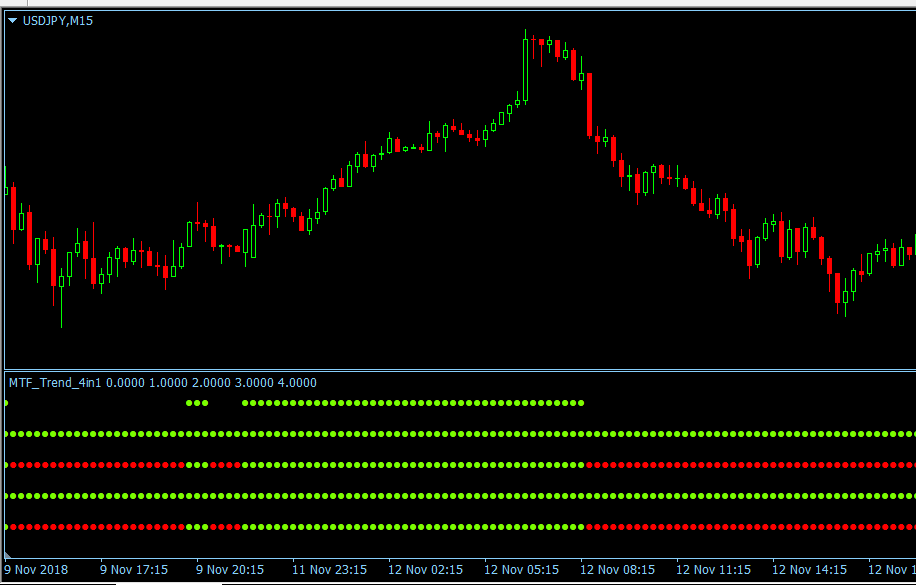
This MTF trend indicator shows the trend of current time frame and 3 higher time frames in a single chart. In addition, it will check the consistence of all 4 time frames.
The green dots represent uptrend, and the red dots represent downtrend.
The ‘trend period’ is used to measure the direction of price within the given number of bars.
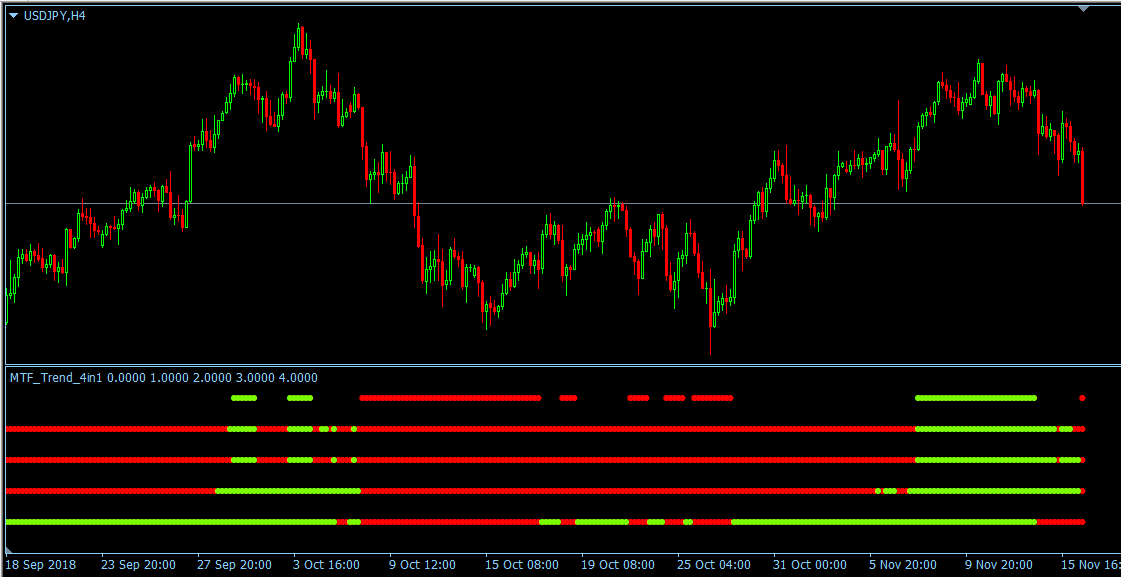
The dots of value 0 is the trend of current timeframe.
The dots of value 1 at the bottom is the trend of ‘timeframe 1’
The dots of value 2 is the trend of ‘timeframe 2’
The dots of value 3 is the trend of ‘timeframe 3’
If current and 3 higher time frames are in the same direction, the dots at the top will appear.
Otherwise, there will be no dots at value 4.
‘timeframe1’ ‘timeframe2’ and ‘timeframe3’ must be higher than current timeframe, if your chart is 15min, ‘timeframe1’ ‘timeframe2’ and ‘timeframe3’ must be 30min or higher.

Due to the nature of MTF, the plots from higher timeframes may vary before the related higher timeframe bar is closed. For example, a chart used 4-hour as TF3, assuming the 4-hour bar is start from 8:00 and end at 12:00, then the color of dots inside the box may change between 8:00 and 12:00. After 12:00 the 4-hour bar is closed, then the color of dots inside the box is fixed, it won’t change anymore.


`