The Thrusting Pattern is a two-candle bearish continuation sequence that often catches novice traders off guard. It frequently appears during established downtrends, masquerading briefly as a potential bullish reversal before confirming that sellers retain complete control of the market.
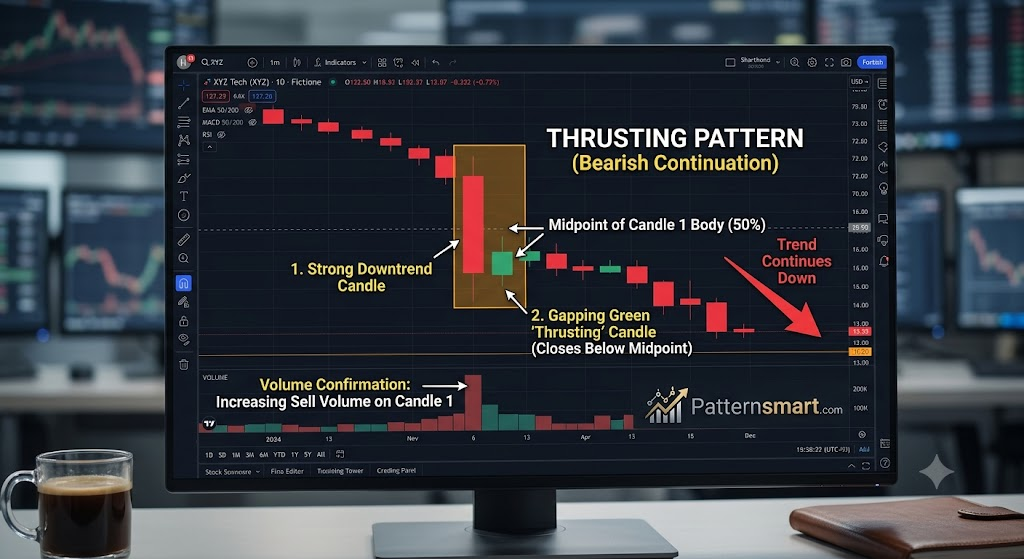
Understanding its structural anatomy and the underlying order flow is essential for avoiding a classic “bull trap.”
Anatomy of the Thrusting Pattern
The pattern occurs over two consecutive trading sessions and is defined by a specific price reaction at a key horizontal layer.
- Candle 1 (The Trend Driver): A strong, long-bodied bearish (red or black) candle that prints firmly within an ongoing downtrend. This confirms strong selling momentum.
- Candle 2 (The Reaction): A bullish (green or white) candle that gaps down at the open, dipping below the low of Candle 1. However, buyers step in intraday, driving the price upward. Crucially, Candle 2 closes inside the real body of Candle 1, but below its midpoint (the 50% retracement level).
The Psychological Shift: The Mechanics of a Bull Trap
To effectively trade the Thrusting pattern, you must look past the shapes and interpret the shifting supply and demand dynamics:
- The Bearish Dominance (Candle 1): Short-sellers are firmly in the driver’s seat, pushing prices down aggressively.
- The Oversold Bounce (Candle 2 Open): The next session gaps down, often reaching an oversold territory or a minor support level. Counter-trend buyers and profit-taking shorts view this dip as an entry opportunity, creating a sharp intraday rally.
- The Failure to Launch (Candle 2 Close): Despite the bullish momentum during the session, the buying pressure is insufficient. The bulls fail to push the price past the 50% halfway mark of Candle 1’s real body. This lack of follow-through signals that the bounce is weak, institutional supply is capping the market, and the primary downtrend is poised to resume.
Thrusting vs. Piercing Line vs. In Neck
It is vital to distinguish the Thrusting pattern from two structurally similar patterns, as misidentifying them can lead to opposite trading decisions:
- Piercing Line (Bullish Reversal): Like the Thrusting pattern, it starts with a bearish candle and a gap down. However, the second bullish candle closes above the 50% midpoint of the first candle. This demonstrates true bullish reversal strength.
- Thrusting Pattern (Bearish Continuation): The second candle closes below the 50% midpoint of the first candle. It represents a weak, failed retracement.
- In Neck Pattern (Stronger Bearish Continuation): The second bullish candle closes at or just barely inside the closing price of the first candle. This represents an even weaker bounce than the Thrusting pattern.
Step-by-Step Trading Strategy
Because continuation patterns can occasionally stall into a broader consolidation, always combine the Thrusting pattern with structural context, volume profile, and strict risk parameters.
1.Establish Macro Context:Prerequisite.
Ensure the market is in a clear, established markdown phase (downtrend). Look for the pattern forming just underneath a broken support level that has flipped to resistance, or below a declining 20-period Exponential Moving Average (EMA).
2.Analyze Volume Dynamics:Candle 2 Confirmation.
Examine the volume on Candle 2. If the bullish bounce occurs on low or declining volume, it confirms a lack of institutional buying interest, validating that the move is merely a temporary retracement.
3.Set the Short Entry Trigger:Execution.
Do not short immediately upon the close of Candle 2. Place a sell-stop order slightly below the low of Candle 2 (or Candle 1, whichever is lower). This ensures you only enter the trade when active selling momentum resumes.
4.Define Stop-Loss and Targets:Risk Management.
Place your stop-loss order just above the high of Candle 2 or the midpoint of Candle 1. Target the next major horizontal support level or key liquidity pool, maintaining a minimum risk-to-reward ratio of 1:2.
Core Takeaways for Your Playbook
- Expectation Management: Treat the Thrusting pattern strictly as a confirmation of the dominant trend rather than a standalone trading trigger. Its primary value lies in preventing you from buying a fake bottom.
- Timeframe Reliability: This pattern carries significant statistical weight on higher timeframes (1-hour, 4-hour, and Daily charts). On lower timeframes (e.g., 5-minute charts), the intraday noise can easily distort the validity of the 50% midpoint rule.
Please check our Bearish and Bullish Patterns Indicator collection.