Evaluate Trend Stability Through Volatility-Based Double Divergence Analysis
A trend can remain directionally intact while the volatility behavior supporting that trend begins to change.
Price may continue advancing, yet the market can become less consistent. A decline may continue while volatility begins behaving differently from the prevailing price structure. These changes do not necessarily mean that a reversal is imminent, but they can provide important information about trend stability and directional consistency.
RVI Double Divergence Pro for MultiCharts combines the Relative Volatility Index (RVI) with the PatternSmart Double Divergence methodology to provide a structured framework for analyzing the relationship between price development and volatility behavior.
Rather than treating volatility divergence as a standalone trading signal, the indicator provides additional technical evidence that can be evaluated within broader market structure and confirmation.
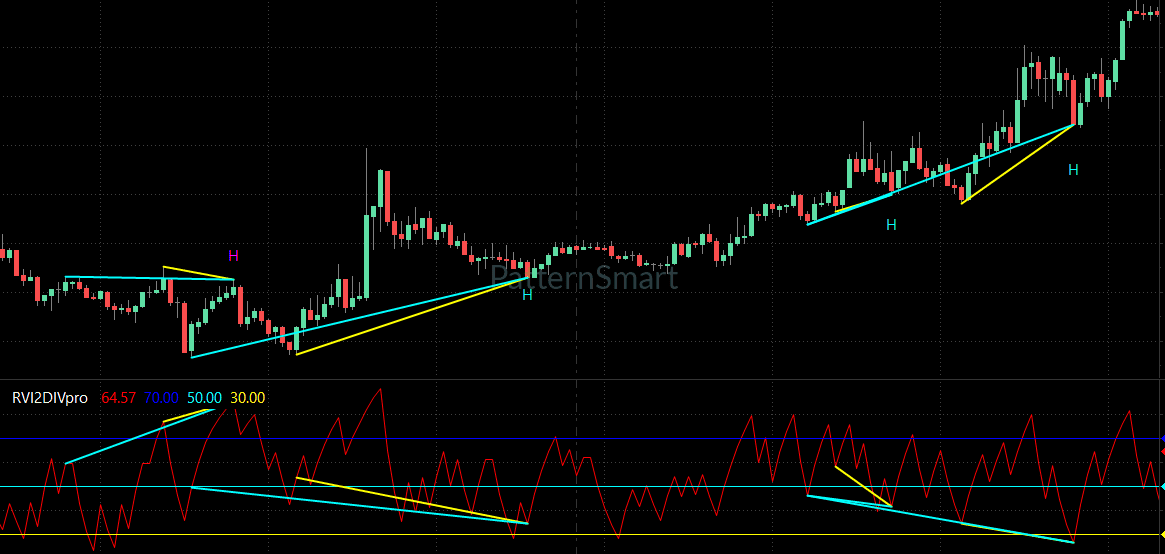
Why Volatility Matters in Trend Analysis
Many technical indicators focus primarily on momentum or price direction. RVI provides a different perspective by evaluating the relationship between volatility and directional price movement.
This makes RVI useful when the analytical question is not simply:
“Where is price going?”
but rather:
“How stable and consistent is the market behavior supporting the current direction?”
Volatility can change while price continues moving in the same direction.
That distinction can be valuable when examining:
- Trend stability
- Directional consistency
- Changing market volatility
- Developing market transitions
- Volatility confirmation
- The quality of an ongoing trend
The RVI Double Divergence approach is therefore designed around volatility analysis rather than conventional momentum interpretation.
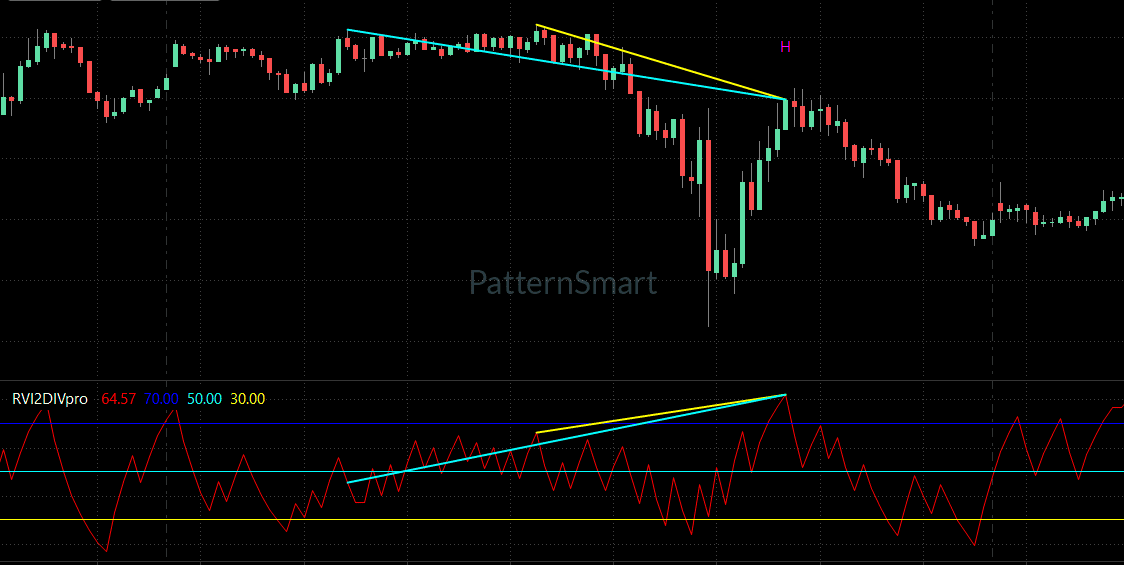
When Volatility and Price Begin to Diverge
Consider an established upward trend.
Price continues to make higher highs, but RVI behavior begins to move differently. The market has not necessarily reversed, yet the volatility characteristics associated with the price movement have changed.
This creates an analytical discrepancy:
Price continues developing → Volatility behavior changes → Divergence appears → Context and confirmation are evaluated
The same principle applies to declining markets.
Price may continue making lower lows while volatility behavior begins to change.
The important observation is not that price must reverse.
Instead, the divergence indicates that price development and volatility behavior are no longer communicating exactly the same information.
That difference may deserve closer examination.
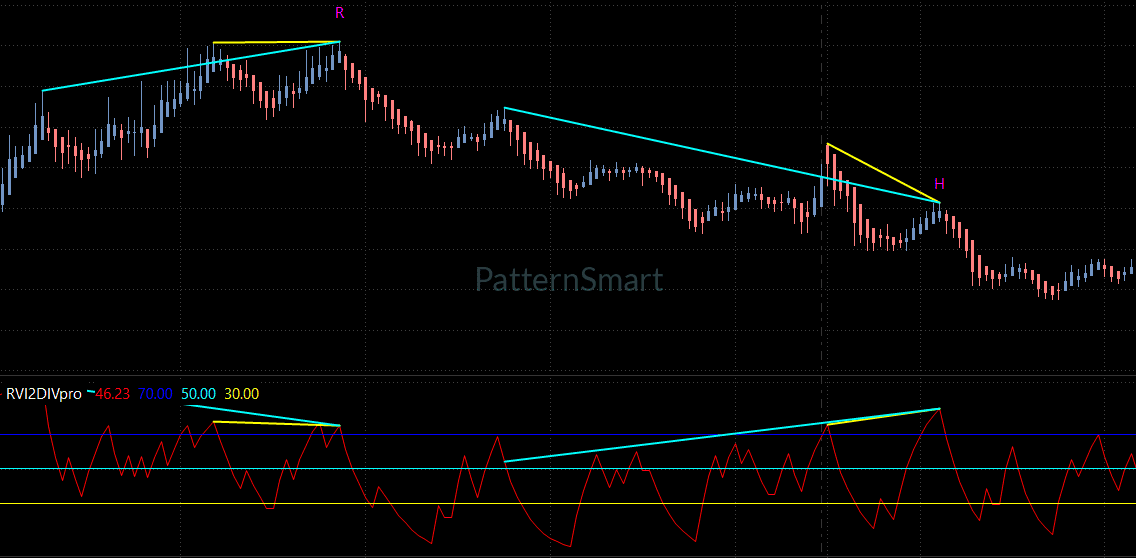
RVI Double Divergence: A Different View of Divergence
PatternSmart Double Divergence applies a consistent methodology across different technical indicators:
Observe → Compare → Confirm → Interpret → Evaluate
The methodology does not change when the underlying indicator changes. What changes is the type of market information being examined.
With RVI, that information is volatility behavior.
This makes RVI Double Divergence particularly useful as a confirmation tool. Rather than attempting to predict price direction, it helps traders evaluate whether volatility characteristics remain consistent with the current market structure.
Additional evidence can come from:
- Price action
- Trend structure
- Support and resistance
- Higher-timeframe conditions
- Market volatility
- Other independent technical observations
Confirmation should strengthen analytical confidence, not create certainty.
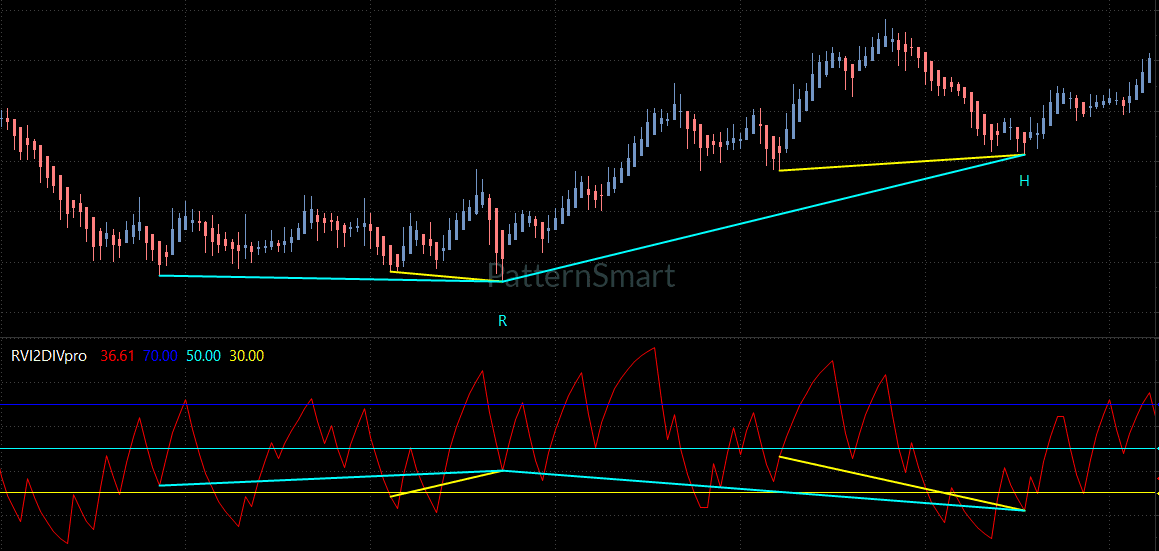
Regular and Hidden RVI Double Divergence
RVI Double Divergence Pro supports four standard divergence classifications.
Bullish Regular Divergence
Bullish Regular Divergence examines a relationship where price forms a lower low while RVI forms a higher low.
Within the RVI framework, this can provide information about changing volatility behavior during a declining market.
It may become relevant when evaluating whether the existing downward movement remains consistent and stable.
Bearish Regular Divergence
Bearish Regular Divergence occurs when price forms a higher high while RVI forms a lower high.
This may indicate that volatility behavior is changing as price continues to advance.
The observation can contribute to evaluating whether the current upward market structure remains consistent.
Bullish Hidden Divergence
Bullish Hidden Divergence examines a higher low in price alongside a lower low in the indicator.
Within an established bullish structure, this can provide another perspective when evaluating trend stability and continuation conditions.
Bearish Hidden Divergence
Bearish Hidden Divergence examines a lower high in price alongside a higher high in RVI.
It can contribute to evaluating whether a broader bearish structure remains consistent during a temporary retracement.
As with all Double Divergence classifications, these relationships should be interpreted within broader market context rather than treated as independent predictions.
RVI for Trend Stability and Market Consistency
RVI has a distinct role within the PatternSmart indicator family.
While:
- ADX focuses on trend strength,
- RSI focuses on momentum,
- Money Flow focuses on buying and selling pressure,
RVI focuses on volatility behavior.
This gives traders an additional analytical dimension when evaluating an existing trend.
A trend can appear strong from a price perspective while its volatility characteristics become less consistent.
Conversely, changing volatility does not automatically imply that a trend has failed.
RVI Double Divergence therefore works particularly well as a complementary analytical perspective for:
- Trending markets
- Volatile markets
- Transitional market environments
- Trend evaluation
- Volatility studies
- Confirmation analysis
The Indicator Knowledge Base specifically identifies trend stability, directional consistency, and volatility confirmation as the central RVI themes.
Flexible RVI Configuration
RVI Double Divergence Pro provides configuration options that allow traders to adapt the analytical process to different research objectives.
RVI Period
The RVI calculation uses a configurable RVI Period, allowing users to control the period applied to the underlying RVI analysis.
Divergence Bar Range
Divergence Bar Range provides:
- ShortRange
- MidRange
- LongRange
These choices define the structural scope used when evaluating divergence relationships.
Divergence Lookback
Divergence Lookback controls the historical range used during swing-point evaluation.
Filter Length
Filter Length controls smoothing applied during structural evaluation.
These settings refine the analytical process without creating different divergence methodologies. The official Inputs Manual identifies these parameters as part of the structural evaluation framework.
Confirmation with Wait 1 Bar
Wait 1 Bar provides an additional confirmation stage before a detected divergence is finalized.
When enabled, the indicator waits for one completed bar before confirming the signal.
This is particularly relevant when evaluating volatility because short-term volatility changes can occur rapidly.
The distinction is important:
Wait 1 Bar changes confirmation timing.
It does not change the underlying divergence methodology.
The PatternSmart Inputs Manual defines Wait 1 Bar as a Signal Generation feature rather than a separate filtering methodology.
Enhanced Mode for Additional Structural Validation
Enhanced Mode provides an additional structural validation stage before a potential divergence signal is confirmed.
This can be useful when the objective is to place greater emphasis on structural consistency.
Enhanced Mode should not be confused with Wait 1 Bar. The two features serve different functions within the confirmation workflow:
- Wait 1 Bar delays confirmation.
- Enhanced Mode applies additional structural validation.
Both remain part of the broader confirmation-first philosophy.
Focus the Chart on Relevant Divergence Types
RVI Double Divergence Pro provides independent controls for:
- Show Regular Bullish
- Show Regular Bearish
- Show Hidden Bullish
- Show Hidden Bearish
This allows traders to concentrate their analysis on the divergence categories relevant to the current research objective.
For example, a trader evaluating potential changes in trend stability may focus on Regular Divergence, while a continuation-oriented analysis may examine Hidden Divergence.
The controls allow selective analysis without changing the underlying methodology.
Clear Visualization of Volatility Divergence
RVI Double Divergence Pro includes visualization controls such as:
- Show Char
- Show Line
- Only Show Last Signal Within Bars
- Price Line Dash Style
- Price Line Width
These settings help organize how divergence information appears on the chart.
Show Line provides visual representation of divergence relationships, while Show Char controls signal labels.
Only Show Last Signal Within Bars can help reduce excessive historical annotations and maintain a cleaner analytical workspace.
These are presentation controls and do not change the underlying divergence calculations.
Alerts for Volatility Confirmation
Enable Alert and Alert Sound provide notification options for confirmed divergence signals.
For traders monitoring multiple markets, alerts can reduce the need for continuous chart observation.
This is particularly useful within a systematic workflow where the objective is to identify when a predefined analytical condition has been confirmed and then evaluate it within the broader research process.
Alerts communicate confirmed information; they do not determine whether the underlying divergence exists.
RVI Double Divergence Pro in MultiCharts
MultiCharts is designed for systematic traders, strategy developers, quantitative traders, portfolio traders, and professional technical analysts. Its environment emphasizes strategy development, backtesting, optimization, portfolio analysis, and rule-based workflows.
This makes MultiCharts a natural environment for incorporating volatility-based technical evidence into a repeatable analytical process.
A research workflow might look like:
Market Selection
↓
Price Structure Analysis
↓
RVI Volatility Analysis
↓
Double Divergence
↓
Confirmation
↓
Strategy Evaluation
↓
Portfolio-Level Analysis
The purpose is not to turn every divergence into an automated decision.
Instead, RVI Double Divergence can become one component of a systematic research framework where volatility behavior is evaluated consistently across markets and historical conditions.
The platform provides the workflow environment; the PatternSmart methodology remains unchanged.
Practical Applications of RVI Double Divergence
Evaluate Trend Stability
RVI provides another perspective for assessing whether volatility behavior remains consistent with an ongoing trend.
Study Directional Consistency
Divergence can identify situations where price continues moving while volatility characteristics begin changing.
Add Volatility Confirmation
RVI can complement price-based and trend-based analysis by introducing volatility as an independent analytical perspective.
Examine Transitional Markets
Changing volatility can become particularly relevant when a market moves from one condition to another.
Support Systematic Research
MultiCharts users can incorporate RVI divergence into structured strategy research and repeatable market evaluation.
The goal is better organization of technical evidence—not a promise of a particular market outcome.
Who Is RVI Double Divergence Pro For?
RVI Double Divergence Pro is particularly relevant to:
- Experienced technical analysts
- Trend-following traders
- Swing traders
- Futures traders
- Volatility-focused traders
- Systematic traders
- Strategy developers
- Traders studying trend stability
- Analysts incorporating volatility confirmation
It is especially appropriate for users who want to examine volatility behavior as a complement to traditional price and momentum analysis.
Frequently Asked Questions
What does RVI measure?
RVI evaluates the relationship between volatility and directional price movement. Within the PatternSmart framework, its primary analytical role is volatility analysis rather than conventional momentum analysis.
What is RVI Double Divergence?
RVI Double Divergence compares price development with RVI volatility behavior to identify situations where the two begin behaving differently.
Does RVI Double Divergence predict trend reversals?
No. RVI divergence provides additional technical evidence. It may contribute to evaluating changing trend stability, but it does not determine future price direction.
Why use RVI instead of a momentum oscillator?
RVI provides a volatility-based perspective. RSI and Momentum, for example, focus primarily on momentum, while RVI focuses on volatility behavior and trend consistency.
When is RVI Double Divergence most useful?
The Foundation Knowledge Base identifies trending markets, volatile markets, and transitional market environments as particularly relevant conditions for RVI analysis.
Can RVI divergence help evaluate trend stability?
Yes. Trend stability, directional consistency, and volatility confirmation are central analytical themes of RVI Double Divergence.
What is the difference between Regular and Hidden Divergence?
Regular Divergence is commonly associated with evaluating potential weakening or changing market conditions, while Hidden Divergence can contribute to evaluating continuation within an established market structure.
What does Enhanced Mode do?
Enhanced Mode applies additional structural validation before a potential divergence signal is confirmed. It does not create a new divergence classification.
Does Wait 1 Bar change the divergence calculation?
Wait 1 Bar affects confirmation timing. It does not change the underlying Double Divergence methodology.
Can RVI Double Divergence be incorporated into systematic strategies?
The indicator can be incorporated into structured MultiCharts research and strategy-development workflows. The appropriate use of any technical observation remains dependent on the trader’s methodology and evaluation process.
Analyze Trend Stability Through Volatility
Price direction alone does not always reveal how consistently a market is developing.
Volatility provides another dimension.
When price and volatility behavior remain aligned, the market may present a relatively consistent technical picture. When they begin to diverge, the relationship deserves closer examination.
RVI Double Divergence Pro for MultiCharts provides a structured way to study these differences through volatility analysis, trend stability, directional consistency, and confirmation.
For MultiCharts users, it can become part of a disciplined workflow for systematic technical research, strategy development, and portfolio-level evaluation.
Explore RVI Double Divergence Pro for MultiCharts and examine how volatility-based confirmation can complement your existing market analysis.
Educational Disclaimer
RVI Double Divergence Pro is a technical analysis and decision-support tool. Divergence represents analytical information rather than a guaranteed market prediction. RVI observations should be evaluated within broader market context, including price action, market structure, and independent confirmation. No indicator guarantees a particular trading outcome or result.
[Get Started With RVI Double Divergence Pro for MultiCharts]
Looking for the complete mathematical breakdown, step-by-step optimization guides, and advanced trading strategies? Explore our comprehensive documentation:
Visit the Technical Inputs Manual: Double Divergence Pro for full parameter tuning.
Read the master guide on the Double Divergence Indicator Series.