A Double Divergence Indicator is an advanced technical analysis tool designed to identify high-probability trend reversals and continuations by detecting multi-point momentum exhaustion.
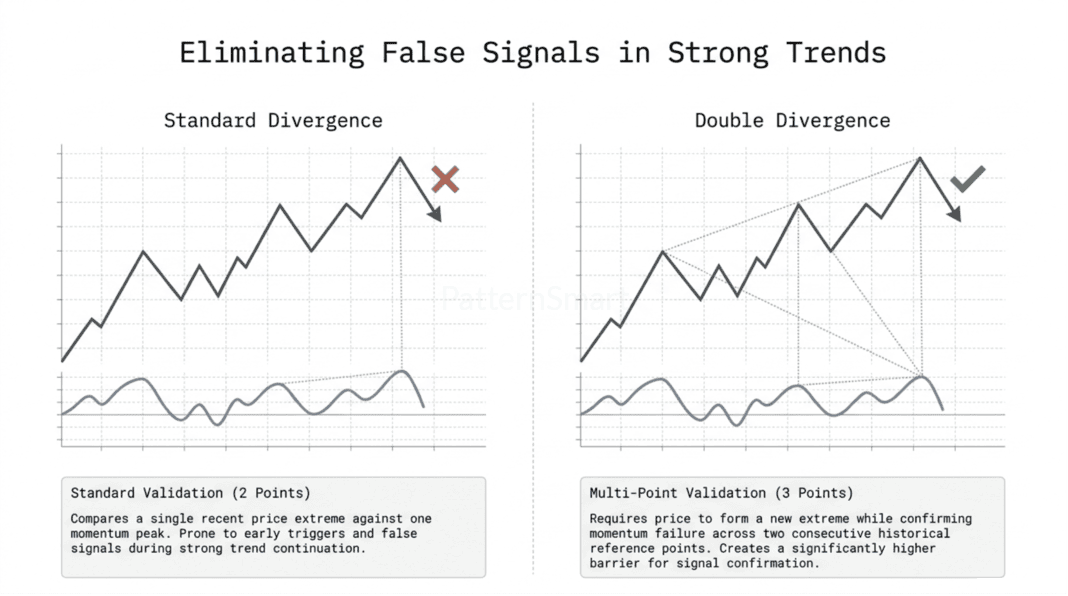
Unlike standard divergence—which compares a single recent price extreme against a corresponding momentum peak or trough—Double Divergence requires a three-point structural alignment. It cross-references two separate historical swing points against the current price action to verify whether momentum is weakening across a broader timeframe.
Key Concepts & Characteristics
- Multi-Point Divergence Validation: Standard divergence can often trigger early during strong trend continuation, leading to false signals. Double Divergence mitigates this risk by requiring price to form a new extreme while confirming that momentum fails across two consecutive historical reference points, creating a much higher barrier for signal confirmation.
- Dual Signal Architecture:
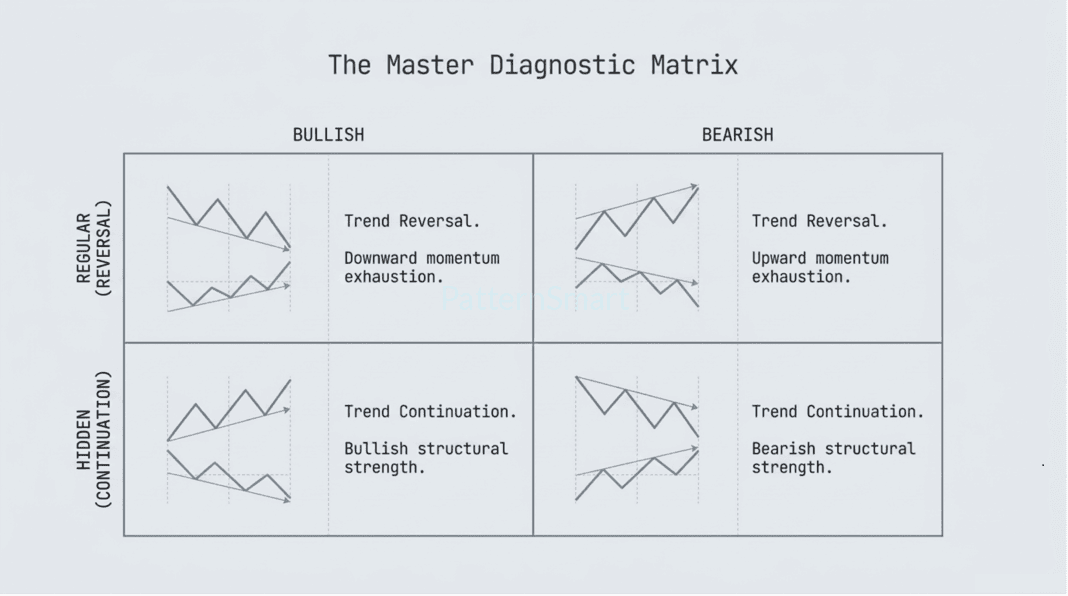
- Regular Double Divergence (Reversal): Signals potential major trend exhaustion. Occurs when price makes a higher high (or lower low) relative to two previous price swings, while the underlying indicator fails to confirm both higher highs (or lower lows).
- Hidden Double Divergence (Continuation): Signals potential trend continuation after a pullback. Occurs when price holds higher lows (or lower highs) relative to two previous swings, while the indicator prints lower lows (or higher highs).
- Indicator Agnostic: While frequently implemented using directional or trend-strength metrics (such as ADX, RSI, MACD, or Stochastic), the underlying structural logic functions across any momentum oscillator or volume-based metric.
- Confirmation Filter: The indicator incorporates structural swing-point confirmation and momentum baseline filters (such as moving average thresholds) to filter out market noise during hyper-volatile or range-bound conditions.
Here are the definitions for the four types of Double Divergence, structured around their structural price patterns, momentum behaviors, and market implications:
1. Regular Bullish Double Divergence (Trend Reversal)
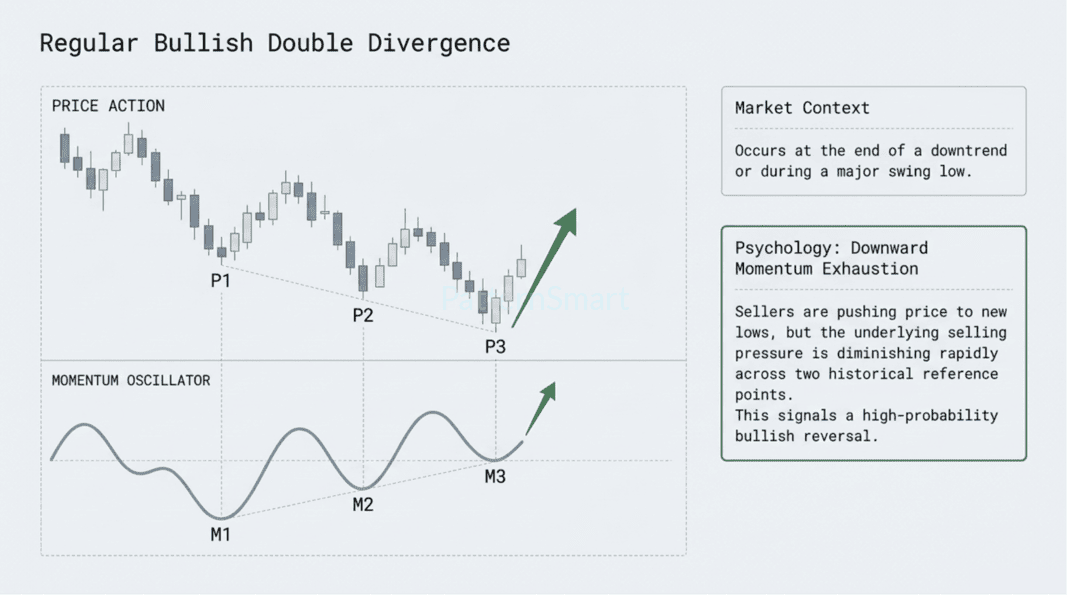
- Market Context: Occurs at the end of a downtrend or during a major swing low.
- Price Behavior: Price makes a new low relative to two previous price swing lows (forming three progressively lower or equal price bottoms).
- Momentum Behavior: The momentum indicator fails to confirm the lower price lows, forming higher troughs across both historical reference points.
- Market Signal: Indicates downward momentum exhaustion. Sellers are pushing price lower, but underlying selling pressure is diminishing rapidly, signaling a high-probability bullish reversal.
2. Regular Bearish Double Divergence (Trend Reversal)

- Market Context: Occurs at the peak of an uptrend or during a major swing high.
- Price Behavior: Price makes a new high relative to two previous price swing highs (forming three progressively higher or equal price tops).
- Momentum Behavior: The momentum indicator fails to confirm the higher price highs, forming lower peaks across both historical reference points.
- Market Signal: Indicates upward momentum exhaustion. Buyers are driving price to new highs, but underlying buying volume or intensity is fading, signaling a high-probability bearish reversal.
3. Hidden Bullish Double Divergence (Trend Continuation)
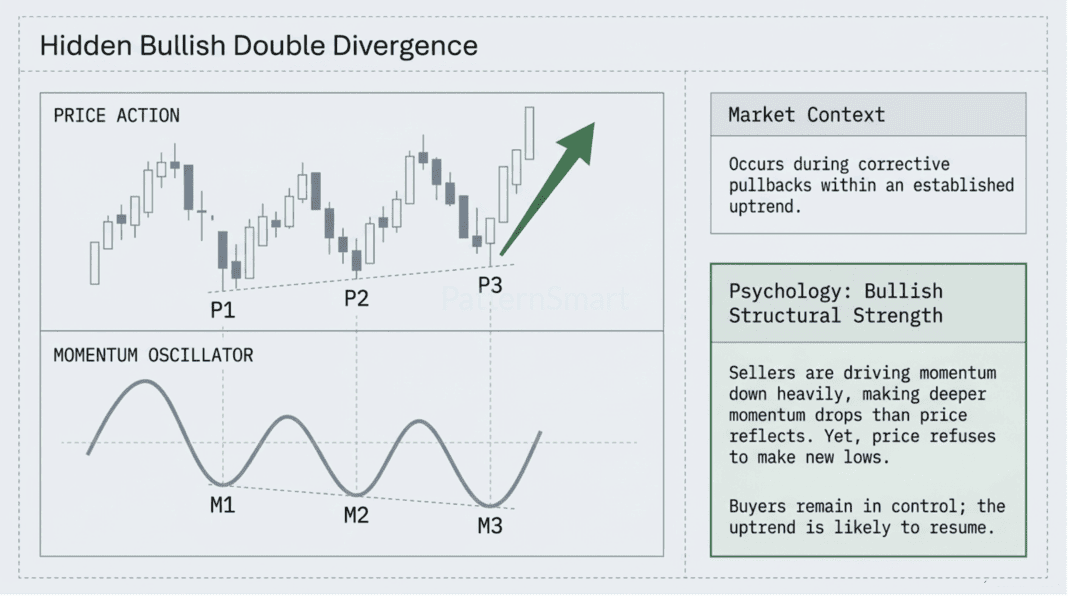
- Market Context: Occurs during pullbacks within an established uptrend.
- Price Behavior: Price holds higher lows relative to two previous price swing lows, maintaining the broader higher-low structural pattern.
- Momentum Behavior: The momentum indicator prints lower troughs across both historical reference points, making deeper momentum drops than price reflects.
- Market Signal: Indicates bullish structural strength. Sellers are driving momentum down heavily, yet price refuses to make new lows, signaling that buyers remain in control and the uptrend is likely to resume.
4. Hidden Bearish Double Divergence (Trend Continuation)
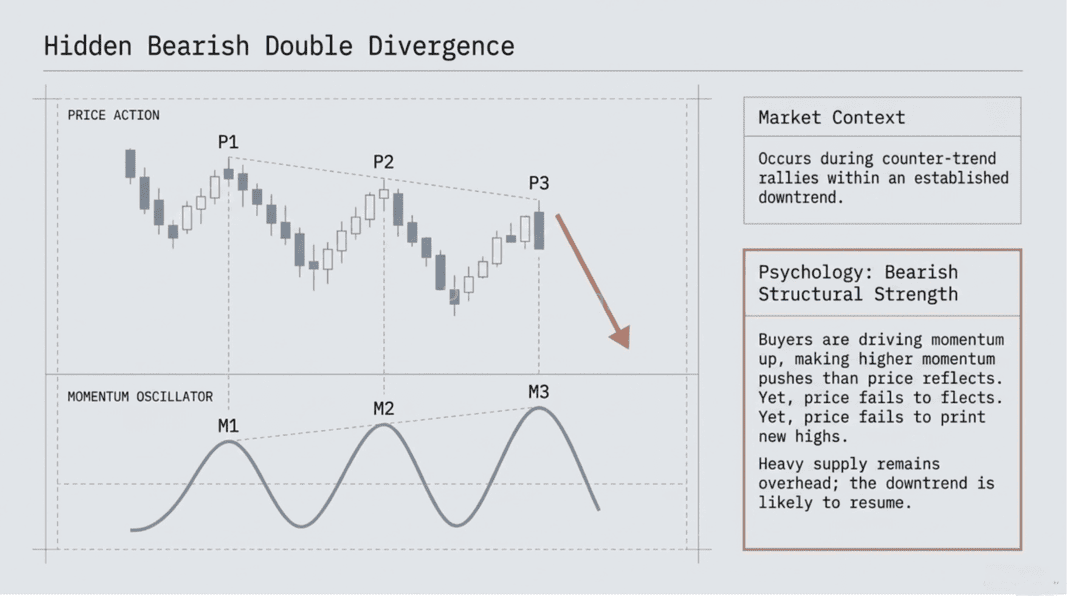
- Market Context: Occurs during rallies/pullbacks within an established downtrend.
- Price Behavior: Price holds lower highs relative to two previous price swing highs, maintaining the broader lower-high structural pattern.
- Momentum Behavior: The momentum indicator prints higher peaks across both historical reference points, making higher momentum pushes than price reflects.
- Market Signal: Indicates bearish structural strength. Buyers are driving momentum up, yet price fails to print new highs, signaling that heavy supply remains overhead and the downtrend is likely to resume.
Looking for the complete mathematical breakdown, step-by-step optimization guides, and advanced trading strategies? Explore our comprehensive documentation:
Visit the Technical Inputs Manual: Double Divergence Pro for full parameter tuning.
Read the master guide on the Double Divergence Indicator Series.