In technical analysis, identifying the exact structural top of an asset’s macro rally is one of the most challenging yet lucrative skills a trader can develop. While single-candle triggers like the Hanging Man hint at underlying weakness, the market frequently requires a more robust, multi-session confirmation before a major trend shifts.
The Evening Star is a three-candle, highly reliable bearish reversal pattern. It represents a complete, systematic shift in market psychology—a transition from absolute bullish dominance to a definitive takeover by institutional sellers. When it prints at the peak of a prolonged upward run, it serves as a stark warning to exit long positions and prepare for a bearish descent.
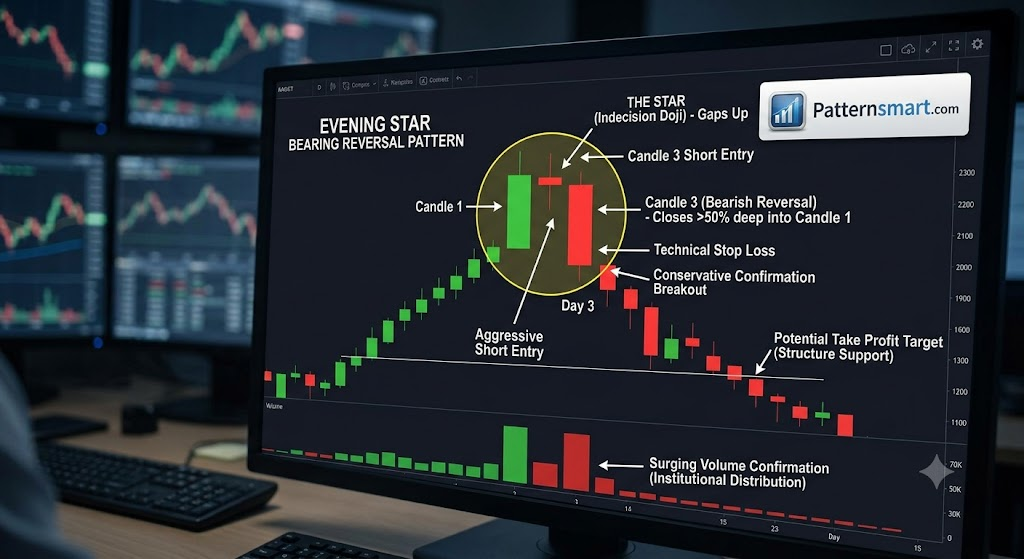
Anatomy of the Evening Star Pattern
To separate a valid Evening Star from random intraday noise, look for a strict three-session sequence:
- Trend Context: The pattern must appear at the apex of a well-defined, established uptrend or near a major horizontal resistance zone.
- Candle 1 (Bullish Expansion): A long, strong bullish (green or white) candle that aligns completely with the dominant uptrend. This candle shows buyers are firing on all cylinders.
- Candle 2 (The Star):
- A small-bodied candle (indecision) that gaps up above the close of Candle 1.
- The color of the body is largely irrelevant—it can be green, red, or even a Doji (which forms an Evening Doji Star). The defining feature is its small size, which represents immediate momentum deceleration.
- Candle 3 (Bearish Reversal): A large, impulsive bearish (red or black) candle that opens below the star and drives downward aggressively. Crucially, its real body must penetrate at least 50% or deeper into the real body of Candle 1.
Evening Star vs. Morning Star
It is essential to understand that the Evening Star has a direct structural mirror at market bottoms:
| Feature | Evening Star | Morning Star |
| Trend Location | Occurs at the top of an uptrend. | Occurs at the bottom of a downtrend. |
| Market Sentiment | Bearish Reversal | Bullish Reversal |
| Anatomy of Day 3 | Long red candle closing deep in Day 1’s body. | Long green candle closing deep in Day 1’s body. |
Market Psychology: The Three-Act Tragedy for Bulls
The power of the Evening Star lies in its sequence, which perfectly captures the sudden exhaustion of buyer demand and the introduction of heavy institutional distribution:
- Act 1: Euphoria (Day 1): The bulls push prices aggressively higher, satisfied that the uptrend is perfectly healthy. Optimism is high.
- Act 2: Stagnation (Day 2): The market gaps up on the open, demonstrating a residual burst of buying pressure. However, the asset completely stalls intraday. Buyers are suddenly unwilling to bid the price higher at these expensive valuations, and sellers begin capping the market. The tiny real body reveals a state of perfect structural equilibrium—a structural stalemate.
- Act 3: The Panic (Day 3): The stalemate breaks violently to the downside. Institutional sellers aggressively step into the market, driving the price deep back into territory that the bulls thought they had secured on Day 1. Seeing the rapid reversal, trapped buyers begin liquidating their positions, adding fuel to the downward momentum.
How to Trade the Evening Star Pattern
Because the Evening Star unfolds over three distinct sessions, it inherently provides more structural validation than single-candle setups. Here is how to execute a high-probability trade around it:
1. The Entry Strategy
- The Aggressive Entry: Execute a short position right before the market close on Day 3, provided that the candle’s body has successfully penetrated deeper than the 50% midpoint of Day 1’s body.
- The Conservative Entry: Wait for the next candle (Day 4) to break below the lowest point of the entire three-candle structure. This confirms that the market has officially chosen its downward direction.
2. Strategic Placement
- Stop-Loss: Place your technical stop-loss just above the highest wick of the Day 2 Star. If the market rallies back and breaches this high, it means the supply block was successfully absorbed, and the bearish thesis is completely invalidated.
- Take-Profit: Target major historical liquidity pools, structural demand levels, or dynamic trend line support zones further down the chart.
Technical Confluence: To supercharge the accuracy of an Evening Star setup, look at the underlying volume signature. A pristine setup will exhibit heavy volume on Day 1, lower/anemic volume on Day 2 (confirming buyers are drying up), and a massive surge in volume on Day 3. This volume expansion validates that institutions are actively funding the reversal.
Please check our Bearish and Bullish Patterns Indicator collection.