While standard candlestick patterns like the Three Black Crows are well-known to momentum traders, its rarer, more aggressive cousin—the Identical Three Crows—demands a unique level of respect.
Appearing at the peak of an uptrend, this three-candle structure is one of the most definitive, visually striking bearish reversal indicators in technical analysis. When it prints, it signals that the bulls have not just lost their footing; they have completely left the building.
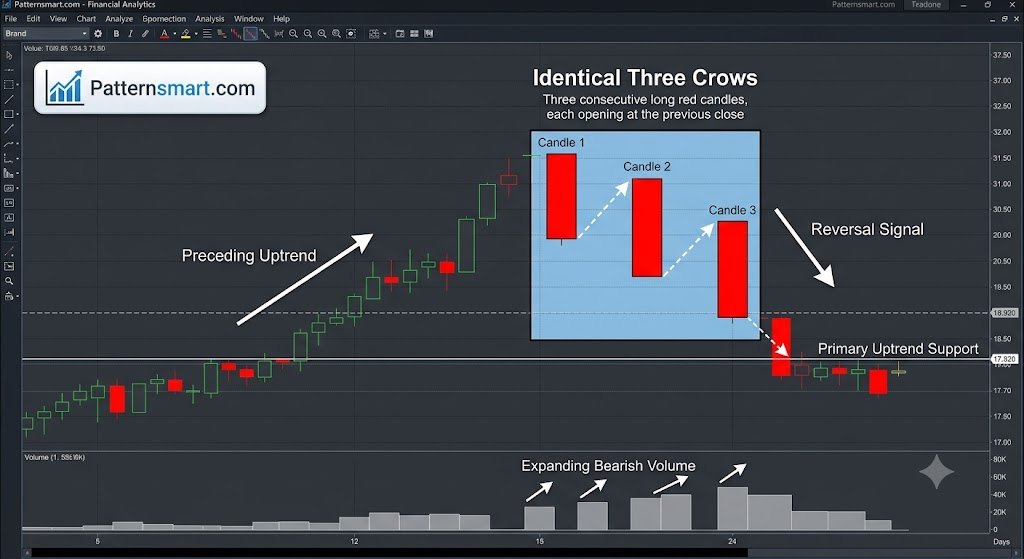
Anatomy of the Identical Three Crows Pattern
To separate a true Identical Three Crows pattern from standard bearish price action, it must fulfill highly rigid structural criteria:
- Trend Context: A prolonged, established uptrend must precede the pattern.
- Three Long Bearish Candlesticks: The pattern consists of three consecutive, long-bodied red (or black) candles that close near their session lows.
- The “Identical” Opening Rule: This is the defining characteristic. The open of Candle 2 must be exactly at or incredibly close to the close of Candle 1. Similarly, the open of Candle 3 must be exactly at or near the close of Candle 2.
Identical vs. Standard Three Black Crows
The distinction between these two patterns is entirely structural and highlights a significant difference in market urgency:
| Feature | Standard Three Black Crows | Identical Three Crows |
| Opening Prices | Each candle opens inside the real body of the preceding candle. | Each candle opens at the exact close of the preceding candle. |
| Intraday Gapping | Implies mild intraday pullback/liquidity hunting before falling. | Implies zero upward bounce; immediate, relentless selling pressure from the opening bell. |
| Reversal Strength | High | Extremely High |
Market Psychology: The Complete Institutional Evacuation
To understand why the Identical Three Crows pattern is so potent, we have to look at the battlefield dynamics between buyers and sellers:
- The Peak and Immediate Supply: The market hits the top of an uptrend. On Day 1, a wave of institutional profit-taking or short-selling catches bulls off-guard, driving price action down into a long red candle.
- The Absence of “Buy the Dip”: On Day 2, you would typically expect a bullish bounce or a higher open as dip-buyers attempt to defend the trend. Instead, the market opens exactly where it closed on Day 1. There is no premium, no gap up, and absolutely no buying enthusiasm. Sellers take control immediately from the opening bell and push the price lower.
- The Capitulation Cascade: Day 3 repeats Day 2’s exact behavior. Opening precisely at the previous close, the asset undergoes a final cascade of liquidation. Trapped longs abandon their positions, creating a self-fulfilling wave of selling that cements the trend reversal.
How to Trade the Identical Three Crows
Because this pattern requires intense, sustained volume to form, it rarely results in a “false alarm.” However, managing risk properly on such an aggressive pattern is paramount because the market can become short-term oversold.
1. The Entry Strategy
- The Aggressive Approach: Enter a short position at the immediate close of the third candle. This ensures you do not miss the initial breakdown velocity.
- The Conservative Approach: Because three consecutive long down-candles leave the market extended, aggressive traders often wait for a minor, low-volume rest or counter-test of the Day 3 candle’s midpoint before executing a short order.
2. Strategic Placement
- Stop-Loss: Place your structural stop-loss just above the high of Candle 1. If the market rallies back and invalidates the origin of this massive supply block, the bearish thesis is broken.
- Take-Profit/Targets: Look to historical support structures, key horizontal demand zones, or Fibonacci extension levels on the macro chart.
Volume Validation: A textbook Identical Three Crows pattern should feature expanding volume across all three days. If volume increases with each subsequent red candle, it confirms institutional distribution and significantly increases the probability of a multi-week downward trend.
Summary for the Active Trader
The Identical Three Crows pattern is a definitive warning sign. It shows a market completely devoid of upward liquidity, where sellers are comfortable executing size right at the previous bid without needing to wait for a bounce. When you spot this pattern on a high-timeframe chart, step away from long positions and prepare for a structural macro shift.
Please check our Bearish and Bullish Patterns Indicator collection.