The In-Neck pattern is a two-candle, bearish continuation structure that appears during an established downtrend. It serves as a stark warning to counter-trend buyers: the sellers are firmly in control, and the brief upward bounce is likely a trap.
Understanding the anatomy and market psychology behind this pattern can help you avoid buying a false bottom and spot high-probability short setups.
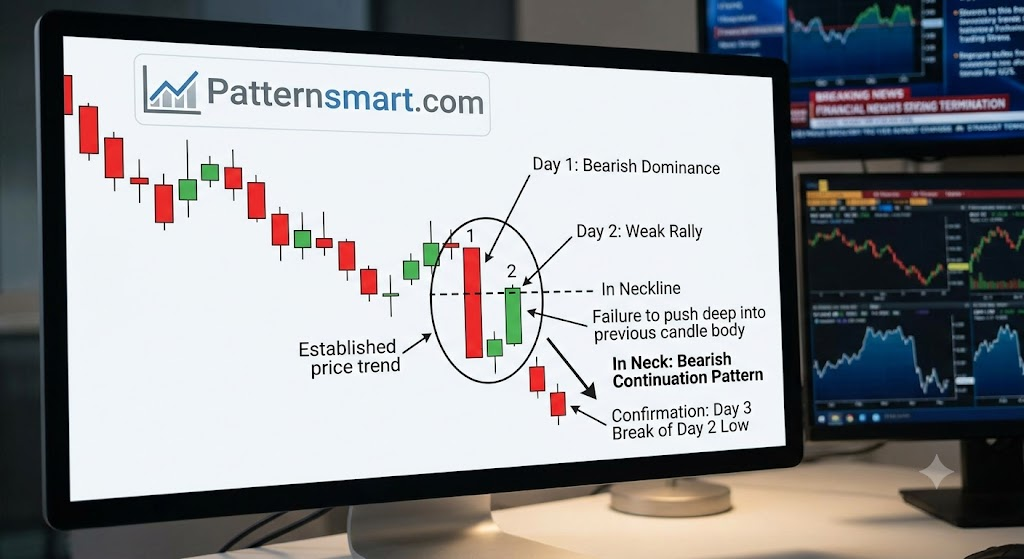
Anatomy of the In-Neck Pattern
To correctly identify an authentic In-Neck pattern, look for these specific criteria across two consecutive trading sessions:
- Trend Context: The market must be in a well-defined downtrend.
- Candle 1 (Bearish Dominance): A long, bearish (red or black) candle that reinforces the existing downward momentum.
- Candle 2 (The Flawed Bounce):
- Opens with a gap down below the low of Candle 1.
- Rallies during the session but closes slightly above the close of Candle 1.
- Crucially, the close fails to penetrate deep into the real body of Candle 1; it merely ticks just inside the “neckline” of the previous session’s close.
In-Neck vs. Similar Continuation Patterns
It’s easy to confuse the In-Neck with other setups. The core difference lies entirely in where the second candle closes:
| Pattern | Day 2 Close Location | Bearish Strength |
| On-Neck | Closes exactly at the low of Day 1’s body/shadow. | Extremely Bearish |
| In-Neck | Closes slightly inside the bottom of Day 1’s real body. | Moderately Bearish |
| Thrusting | Closes near, but just below, the midpoint of Day 1’s body. | Weakly Bearish |
| Piercing Line | Closes above the midpoint of Day 1’s body. | Reversal (Bullish) |
Market Psychology: What the Chart is Telling You
The In-Neck pattern tells a clear story of an aggressive bear market overpowering a weak bull counter-attack.
- The Bears Push: On Day 1, sellers drive the price down aggressively, creating a solid red candle. Momentum is entirely on their side.
- The Fake Out: On Day 2, enthusiasm or profit-taking causes the market to open lower (the gap down). Seeing a “discount,” bulls step in to buy the dip, driving the price upward.
- The Collapse: Despite their intraday effort, the bulls run completely out of steam right around the previous day’s closing price. They cannot push the price deep into yesterday’s territory. This failure shows that the buying pressure is shallow, setting up the next leg down as trapped buyers begin to liquidate their positions.
How to Trade the In-Neck Pattern
Because candlestick patterns can occasionally fail, you should never trade the In-Neck in isolation. Always wait for validation.
1. Wait for Confirmation
Do not enter a short position immediately at the close of Day 2. Instead, wait for Day 3. A valid confirmation requires Day 3 to break and close below the low of the Day 2 bullish candle. This proves that the bears have officially resumed control.
2. Strategic Placement
- Entry: Short entry triggers immediately upon a clean break below the Day 2 candle’s low (or at the close of the confirmation candle).
- Stop-Loss: Place your stop-loss just above the high of Day 2 (for an aggressive setup) or above the high of Day 1 (for a safer, wider structural setup).
- Take-Profit: Target local support levels or employ a trailing stop based on a moving average to capture a macro extension downward.
Risk Management Note: Pay close attention to volume. If Day 2’s weak rally happens on exceptionally low volume, it reinforces the lack of institutional buying interest, significantly increasing the probability of a successful bearish continuation.
Please check our Bearish and Bullish Patterns Indicator collection.