In technical analysis, few single-candle formations carry as much psychological weight as the Shooting Star. Positioned at the peak of an upward trend, this pattern acts as an early warning system, signaling that the bulls may finally be losing their grip on the market.
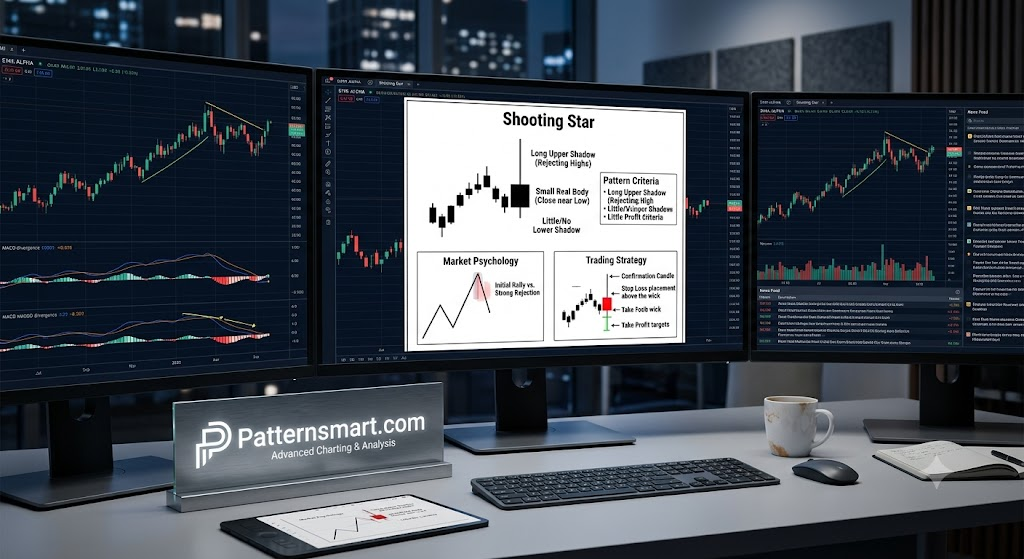
Here is an in-depth breakdown of the mechanics, psychology, and trading strategies behind the Shooting Star.
Anatomy of a Shooting Star
A Shooting Star is a single-candle bearish reversal pattern. Its visual structure is distinct and easy to spot when filtering through charts.
To qualify as a valid Shooting Star, the candlestick must meet three specific structural criteria:
- The Upper Shadow: The upper wick must be long—ideally at least twice the length of the real body. This long wick represents the failed intra-period rally.
- The Real Body: The body sits at the lower end of the price range. While a bearish (red/black) body signifies a stronger reversal because the market closed lower than it opened, a bullish (green/white) body is still considered valid if the other criteria are met.
- The Lower Shadow: There should be little to no lower wick. The close must be very near the absolute low of the period.
Market Psychology: What is Happening Behind the Scenes?
The structural shape of a Shooting Star tells a story of aggressive buyer exhaustion and swift institutional rejection:
- The Opening Drive: Coming off an established uptrend, buyers open the session with high confidence. They aggressively push prices upward to new local highs, maintaining the prevailing momentum.
- The Institutional Wall: At the peak of the session, the price hits a zone of major supply or resistance. Large-scale sellers step in, or profit-takers flood the market with sell orders, overwhelming the buying pressure.
- The Retreat: Sellers seize total control, driving the price all the way back down to close near the session’s open.
The long upper shadow serves as visual evidence of an “unfilled” or trapped pocket of buyers who went long at the absolute high of the day and are now immediately sitting on losses.
Strategic Blueprint: Trading the Setup
Successfully trading a Shooting Star requires patience; acting purely on the appearance of the candle without structural context is a quick way to get stopped out.
1. Location and Context
A Shooting Star is meaningless if it occurs in a choppy, sideways market or in the middle of a consolidation range. It must occur after a sustained advance or at a major daily/weekly technical resistance level.
2. Execution and Confirmation
Aggressive traders sometimes enter right before the market close of the Shooting Star candle. However, conservative risk management dictates waiting for confirmation on the next candlestick.
- Entry: Place a short entry order just below the low of the Shooting Star candle. Confirmation is achieved when the next candle successfully breaks and prints below that low.
- Stop-Loss: Place your stop-loss order slightly above the tip of the long upper shadow. If the price breaks above that high, the bearish thesis is invalidated.
- Take-Profit: Target local support levels, key moving averages, or previous swing lows to establish a minimum 1:2 risk-to-reward ratio.
Strengths and Limitations
While highly reliable when used correctly, no technical indicator works perfectly in isolation.
Key Rule: A Shooting Star is a sign of potential reversal, not an absolute guarantee. Always verify its validity against volume—a Shooting Star accompanied by above-average trading volume carries far more statistical significance than one on weak volume.
| Advantages | Risks & Pitfalls |
| Clear, easily identifiable risk definitions (the high provides a definitive stop out). | High risk of “fakeouts” if traded in strong, secular bull trends. |
| Effective across multiple timeframes (Intraday, Daily, Weekly). | Requires patience for confirmation, which can reduce the ultimate profit margin of the trade. |
Pairing this pattern with secondary indicators—such as looking for an overbought reading on the Relative Strength Index (RSI) or watching for a bearish divergence on the Moving Average Convergence Divergence (MACD)—dramatically increases its win rate.
Please check our Bearish and Bullish Patterns Indicator collection.