The On Neck is a two-candle bearish continuation pattern that typically surfaces during an established downtrend. It serves as a stark reminder of structural weakness, signaling that a brief bullish counter-attack has failed to gain ground, leaving the bears firmly in control.
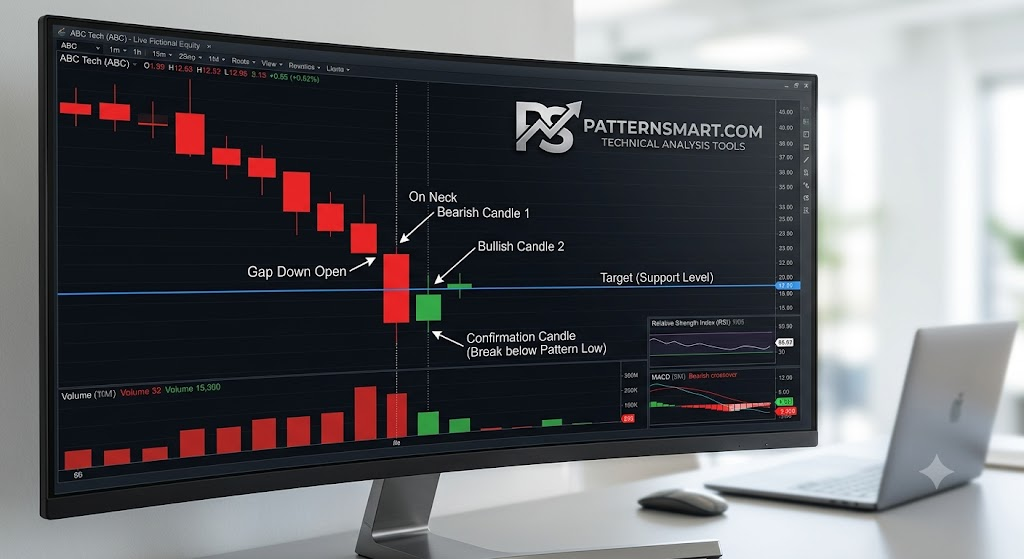
Anatomy of the On Neck Pattern
To correctly identify the On Neck pattern on a chart, look for two distinct candles following a clear downward move:
| Attribute | Candle 1 (The Anchor) | Candle 2 (The Reaction) |
| Trend Context | Pre-existing downtrend | Continuation of the down move |
| Type & Color | Long Bearish (Red/Black) | Smaller Bullish (Green/White) |
| Opening Price | Continues the dominant bearish momentum | Gaps down below the low of Candle 1 |
| Closing Price | Closes near its session low | Rallies to close exactly at the low (or the close) of Candle 1 |
Critical Distinction: The defining feature of the On Neck pattern is that Candle 2 fails to penetrate the real body of Candle 1. It closes precisely at the “neckline” formed by the previous candle’s low or close. If it penetrates deep into the body, it becomes a Piercing Line pattern, which is a bullish reversal.
Market Psychology Behind the Pattern
Understanding what happens behind the scenes helps clarify why this pattern implies a continuation of the trend:
- Dominance: A strong downtrend is in place, punctuated by Candle 1, which shows intense selling pressure.
- The Trap: The next session opens with a gap down, signaling extreme bearishness. Seeing the asset stretched thin, buyers step in to exploit the cheap prices, driving a intraday or intra-session rally.
- The Wall: Despite the buying momentum, the bulls hit a hard ceiling at the prior candle’s low. Sellers aggressively defend this level.
- The Resolution: The session closes without making any progress into the real body of Candle 1. The bulls have exhausted their energy just to fill a fraction of the gap, proving they lack the strength to reverse the macro trend.
Technical Trading Strategies
When executing trades based on the On Neck pattern, reliance on raw candles alone carries execution risk. It requires mechanical confirmation.
1. Entry and Execution
- Short Trigger: Do not enter short the moment Candle 2 closes. Instead, wait for the third candle to break and close below the low of Candle 2. This confirms that the bearish momentum has officially resumed.
- Volume Analysis: Look for expanding volume on Candle 1, lower volume on the retracement of Candle 2, and a fresh surge in volume on the confirmation candle.
2. Risk Management
- Stop-Loss Placement: Place your stop-loss order slightly above the high of Candle 2, or above the middle of Candle 1’s real body if you want to give the trade more breathing room against volatility.
- Take-Profit Target: Measure the height of the pattern or use key support levels further down the daily or weekly charts to establish your target ratios (typically a minimum of $1:2$ Risk-to-Reward).
Comparison: On Neck vs. In Neck vs. Thrusting
The On Neck pattern is part of a structural family of bearish continuation setups. Small differences in the close of the second candle drastically alter the threat level to shorts:
- On Neck: Candle 2 closes exactly at the low of Candle 1. Highly bearish.
- In Neck: Candle 2 closes slightly inside the body of Candle 1 (at or just above the prior close). Moderately bearish.
- Thrusting Line: Candle 2 penetrates deeper into Candle 1’s body but stays below the 50% midpoint. Weakly bearish, often leading to a choppy market.
Please check our Bearish and Bullish Patterns Indicator collection.