Understand Directional Movement and Trend Conditions with Double Divergence
Understanding which direction a market is moving is one of the most important parts of technical analysis. But simply seeing that price is rising or falling does not always tell the complete story.
A market may continue moving higher while directional pressure begins to weaken. It may continue falling even though the underlying directional conditions are changing. These situations can be difficult to recognize from price alone.
DMI Double Divergence for MT5 combines the Directional Movement Index (DMI) with PatternSmart’s Double Divergence methodology to help traders study these changes in a more structured way.
DMI focuses on directional movement, trend confirmation, trend quality, and directional bias. Double Divergence adds another layer by comparing DMI behavior with price movement. This can help traders evaluate whether directional pressure continues to support the current price trend or begins to weaken.
The goal is not to predict exactly what the market will do next. Instead, the indicator provides additional information that can be evaluated alongside price action and broader market conditions.
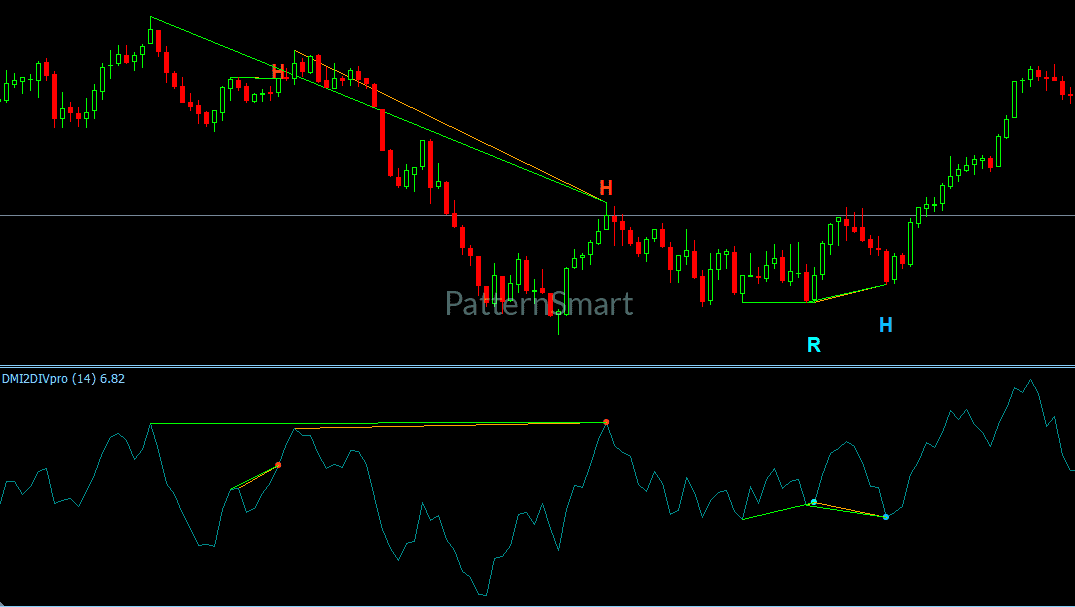
What Is DMI?
DMI stands for Directional Movement Index.
In simple terms, DMI is designed to help traders study directional movement in the market.
Instead of primarily asking whether a market is overbought or oversold, DMI focuses on questions such as:
- Is the market developing a clear directional move?
- Is the current direction receiving continued support?
- Is directional pressure changing?
- Does the current price movement still have strong directional confirmation?
This makes DMI different from indicators that primarily focus on momentum or market extremes.
PatternSmart’s Indicator Knowledge Base specifically describes DMI Double Divergence in terms of directional movement, trend confirmation, trend quality, and directional bias.
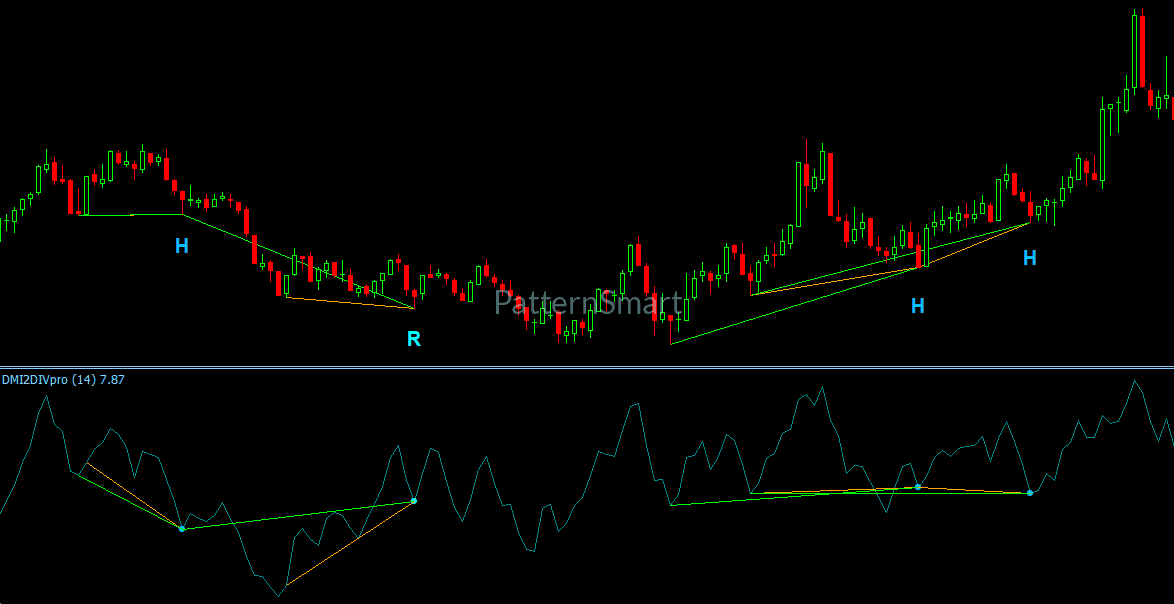
What Is Double Divergence?
Traditional divergence occurs when price and an indicator begin showing different behavior.
For example, price may continue making higher highs while the indicator does not make a corresponding higher high.
This difference can provide useful information because the indicator is no longer completely confirming the latest price movement.
PatternSmart’s Double Divergence methodology takes a structured approach to this relationship.
The methodology emphasizes:
- Confirmation
- Market context
- Consistency
- Disciplined interpretation
A divergence is treated as information, not a prediction. Confirmation can increase confidence in an interpretation, but the signal does not guarantee a reversal, continuation, or profitable trade.
Why Combine DMI With Double Divergence?
DMI already provides a perspective on directional movement.
Double Divergence asks an additional question:
Does DMI continue to confirm what price is doing?
Suppose a market continues advancing and price reaches another high. If DMI does not provide corresponding confirmation, this may indicate that directional conviction is becoming weaker.
The market has not necessarily reversed. However, the difference between price and DMI deserves further evaluation.
This is the primary analytical role of DMI Double Divergence.
The Indicator Knowledge Base explains that DMI divergence can reflect weakening directional conviction while price continues advancing or declining. It can therefore be particularly useful when evaluating trend continuation opportunities.
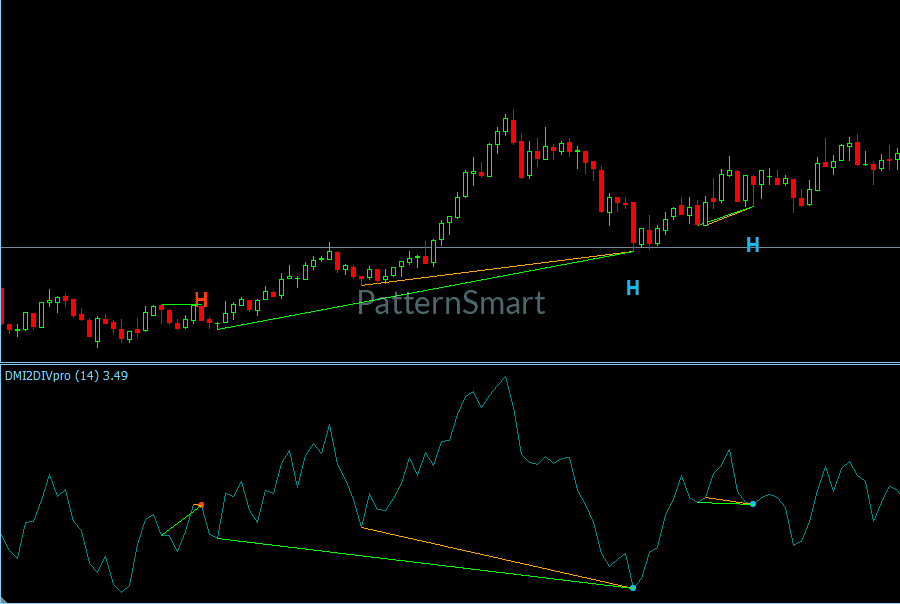
Four Types of Double Divergence
DMI Double Divergence uses four primary divergence classifications.
Understanding these categories is important for beginners because regular and hidden divergence provide different types of information.
Regular Bullish Double Divergence
Regular bullish divergence generally occurs when:
- Price makes a lower low
- The indicator makes a higher low
The indicator is therefore not confirming the full extent of the downward price movement.
Within the PatternSmart methodology, this can be viewed as potential evidence that bearish conditions are changing.
It does not automatically mean that price will reverse upward.
Additional confirmation remains important.
Regular Bearish Double Divergence
Regular bearish divergence generally occurs when:
- Price makes a higher high
- The indicator makes a lower high
This means DMI is not confirming the full strength of the upward price movement.
The observation may suggest that bullish conditions deserve closer evaluation.
Again, it should be treated as analytical information rather than an automatic sell signal.
Hidden Bullish Double Divergence
Hidden bullish divergence generally occurs when:
- Price makes a higher low
- The indicator makes a lower low
This type of divergence is commonly associated with trend continuation.
For example, a market may be in an established bullish trend and experience a temporary pullback. A hidden bullish divergence observation can provide additional information when evaluating whether the broader bullish structure remains intact.
Its significance still depends on the existing trend, market structure, and confirmation.
Hidden Bearish Double Divergence
Hidden bearish divergence generally occurs when:
- Price makes a lower high
- The indicator makes a higher high
This can provide information about potential bearish continuation when a temporary upward correction occurs within a broader bearish structure.
Like all Double Divergence observations, it should be evaluated within the larger market context.
DMI Double Divergence for Trend Confirmation
One of the most natural applications of DMI Double Divergence is trend confirmation.
A trend is more than simply a sequence of rising or falling prices. Traders also need to consider whether the directional conditions supporting that movement remain consistent.
DMI can provide information about directional movement while Double Divergence examines whether that information continues to agree with price.
This creates a useful analytical framework:
- Observe the price trend.
- Examine DMI behavior.
- Look for divergence.
- Evaluate the market structure.
- Seek additional confirmation.
- Interpret the overall evidence.
This approach can help beginners avoid the common mistake of treating one indicator signal as the entire trading decision.
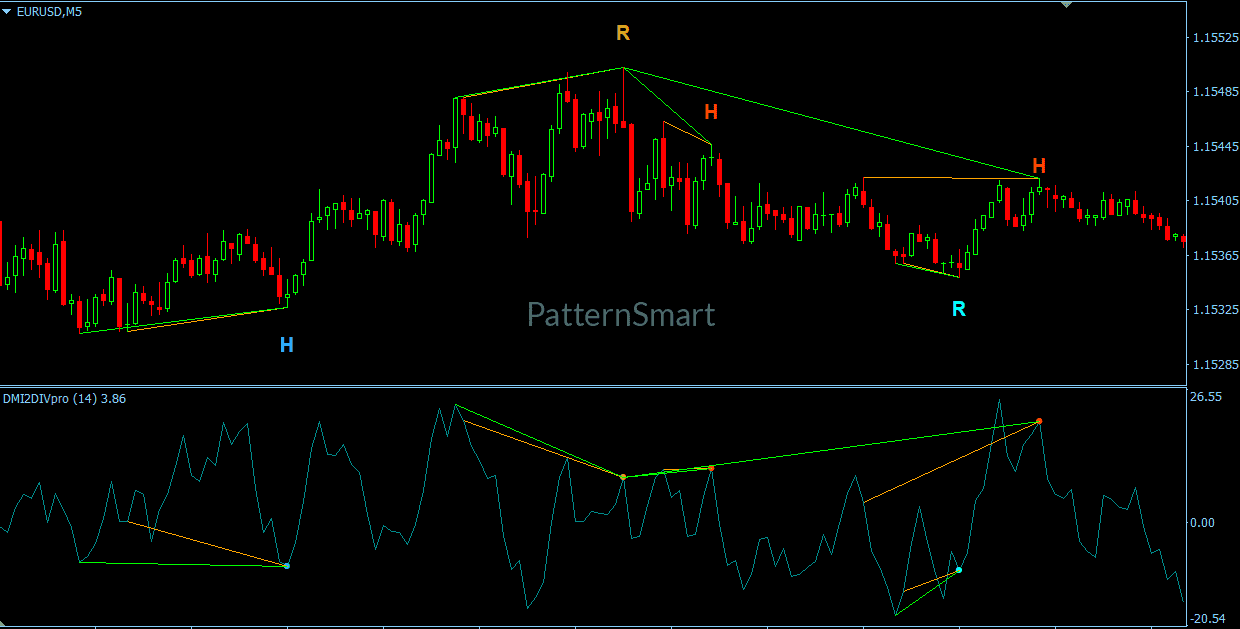
DMI Double Divergence for Trend Continuation
DMI Double Divergence is particularly relevant when studying trend continuation.
Consider a market that is already moving strongly in one direction.
A temporary pullback does not necessarily mean that the broader trend has ended. Hidden divergence can provide additional information when evaluating whether the underlying directional structure remains intact.
Similarly, if price continues moving in the trend direction while DMI begins showing less confirmation, traders may want to examine whether directional conviction is weakening.
The Indicator Knowledge Base identifies trending markets, breakout environments, and directional markets as the conditions where DMI Double Divergence is particularly relevant.
DMI Double Divergence for Breakout Analysis
Breakouts can create important directional opportunities, but not every breakout develops into a sustained trend.
DMI Double Divergence can provide an additional perspective when evaluating directional movement around breakout conditions.
For example, traders may examine:
- The direction of the breakout
- Price structure
- DMI behavior
- Whether directional pressure remains consistent
- Whether divergence develops after the breakout
- Confirmation from other technical factors
The purpose is not to determine automatically whether a breakout will succeed.
Instead, DMI Double Divergence can help traders evaluate the quality and consistency of directional movement.
Features Designed for Flexible Analysis
DMI Double Divergence includes configurable features that allow users to control which divergence information is displayed and how signals are confirmed.
Wait 1 Bar
Wait 1 Bar determines whether the indicator requires one completed confirmation bar before finalizing a detected Double Divergence signal.
When enabled, the indicator waits for the next bar to close before confirming the signal.
This can provide additional confirmation and reduce premature signal confirmation, although the signal may appear slightly later.
When disabled, the signal can be confirmed immediately after the required divergence conditions are satisfied.
Importantly, this setting changes when a signal becomes visible, not the underlying way divergence is detected.
Choose Your Divergence Types
The indicator provides individual settings for:
- Show Regular Bullish
- Show Regular Bearish
- Show Hidden Bullish
- Show Hidden Bearish
This means traders can focus their charts on particular divergence categories.
For example, a trader studying continuation conditions may choose to focus on hidden divergence, while another trader may want to study regular divergence in the context of potential trend changes.
These settings control signal generation and display. They do not change the Double Divergence methodology itself.
Enhanced Mode and Advanced Parameters
For traders who want more control over signal evaluation, DMI Double Divergence includes additional filtering and advanced parameters.
Enhanced Mode
Enhanced Mode is a Signal Filtering feature.
Signal Filtering evaluates detected divergence structures and applies additional validation before a signal is confirmed.
It is important to distinguish filtering from signal generation: Signal Generation determines which divergence types are enabled, while Signal Filtering evaluates the detected structures.
Divergence Bar Range
Divergence Bar Range is an advanced parameter related to divergence structure evaluation.
It can be used as part of the indicator’s internal process for identifying appropriate divergence structures.
Divergence Lookback
Divergence Lookback is used in the evaluation of historical swing points.
Because divergence requires comparison between price and indicator structures, the historical observations considered by the indicator are an important part of the analysis.
Filter Length
Filter Length is another advanced parameter involved in the indicator’s internal analytical process.
These advanced settings are intended for users who want greater control over how divergence structures are evaluated.
Keep Your MT5 Charts Clear
Too much information can make a chart difficult to read.
DMI Double Divergence includes display and visualization controls such as:
- Show Char
- Show Line
- Only Show Last Signal Within Bars
- Price Line Brush
- Price Line Width
- Price Line Dash Style
These settings control presentation rather than signal generation.
For example, Only Show Last Signal Within Bars can help organize historical signals and reduce visual clutter.
Alerts and Notifications
The indicator also includes:
- Enable Alert
- Alert Sound
These features can help traders monitor confirmed signals without continuously watching every chart.
Alerts are notification tools. They do not change the underlying Double Divergence calculation or methodology.
[Get Started With DMI Double Divergence Pro for MT5]
Looking for the complete mathematical breakdown, step-by-step optimization guides, and advanced trading strategies? Explore our comprehensive documentation:
Visit the Technical Inputs Manual: Double Divergence Pro for full parameter tuning.
Read the master guide on the Double Divergence Indicator Series.
DMI Double Divergence and MetaTrader 5
DMI Double Divergence is designed for the MetaTrader 5 environment.
MetaTrader 5 provides a multi-asset trading and technical analysis environment, while the PatternSmart Double Divergence methodology remains consistent across platforms.
This means the core analytical concepts—divergence classification, confirmation, interpretation, and context—do not change simply because the indicator is being used on MT5.
The platform provides the environment in which the methodology is applied.
For traders working across multiple markets, MetaTrader 5’s multi-asset flexibility can complement a DMI-based approach to directional analysis.
When Is DMI Double Divergence Most Useful?
The Indicator Knowledge Base identifies several market conditions where DMI Double Divergence can be particularly useful:
- Trending markets
- Breakout environments
- Directional markets
It is designed around directional movement rather than overbought and oversold analysis.
This makes it particularly relevant to:
- Trend-following traders
- Breakout traders
- Position traders
- Forex traders
- Futures traders
- Traders studying directional market structure
Important Limitation to Understand
DMI Double Divergence is less informative during consolidations.
When price moves sideways without a clear directional structure, there may be less meaningful directional movement for DMI to evaluate.
For this reason, DMI Double Divergence is best used alongside price action rather than as a standalone analytical tool.
This is also consistent with the broader Double Divergence methodology.
No technical indicator should be interpreted in isolation. Market context may include:
- Trend strength
- Market structure
- Volatility
- Support and resistance
- Momentum
- Higher-timeframe conditions
The methodology therefore encourages traders to treat divergence as one component of a broader analytical process.
A Simple Way to Use DMI Double Divergence
For beginners, it can be helpful to think of the indicator as answering three basic questions:
1. What Is Price Doing?
Start with the chart itself.
Is price generally rising, falling, breaking out, or moving sideways?
2. Does DMI Agree?
Next, examine whether directional movement continues to support the price trend.
If price continues moving while DMI behaves differently, a divergence observation may develop.
3. What Does the Rest of the Market Say?
Finally, consider additional evidence.
Look at market structure, support and resistance, higher-timeframe conditions, and price action.
This process helps keep the indicator in its proper role: an analytical tool rather than an automatic decision-maker.
Frequently Asked Questions
What is DMI Double Divergence?
DMI Double Divergence combines the Directional Movement Index with PatternSmart’s Double Divergence methodology to analyze directional movement, trend quality, trend confirmation, and directional bias.
What does DMI measure?
DMI evaluates directional movement within the market. When combined with Double Divergence, it can help traders examine whether directional pressure remains aligned with price movement or begins weakening.
Is DMI a momentum oscillator?
DMI Double Divergence should not be treated as a traditional momentum oscillator. Its primary focus is directional movement, trend confirmation, trend quality, and directional bias.
What types of divergence does the indicator support?
The indicator supports four main categories:
- Regular Bullish
- Regular Bearish
- Hidden Bullish
- Hidden Bearish
Does divergence guarantee a reversal?
No. Divergence is information rather than a prediction. Confirmation and market context remain essential.
Is DMI Double Divergence useful for trend-following?
Yes. Trend following is one of the trading styles identified as suitable for DMI Double Divergence. It is also relevant to breakout and position trading.
Is DMI Double Divergence suitable for sideways markets?
DMI Double Divergence is less informative during consolidations because directional movement is less clearly defined.
What does Wait 1 Bar do?
Wait 1 Bar requires one completed confirmation bar before a detected divergence is finalized when enabled. It changes confirmation timing, not the underlying divergence calculation.
Conclusion
DMI Double Divergence for MT5 provides a structured way for traders to study directional movement and trend conditions through the relationship between price and DMI.
For beginners, its key concept is straightforward:
Price shows what the market is doing. DMI provides information about directional movement. Double Divergence helps you examine whether the two continue to agree.
This makes the indicator particularly relevant to trending markets, breakout environments, and directional market analysis.
At the same time, DMI Double Divergence should not be treated as a standalone prediction tool. Divergence is evidence, not certainty. The most meaningful analysis comes from combining the indicator with price action, market structure, and broader market context.
By approaching the indicator as part of a confirmation-based analytical process, traders can build a clearer understanding of how directional conditions develop, change, and potentially continue.