Understand Momentum Changes with Double Divergence on MetaTrader 5
Price can continue moving in one direction even when the speed of that movement is beginning to change.
A market may still be rising, for example, while the rate at which price is rising starts to slow. Likewise, momentum can begin strengthening before the change becomes obvious in price itself.
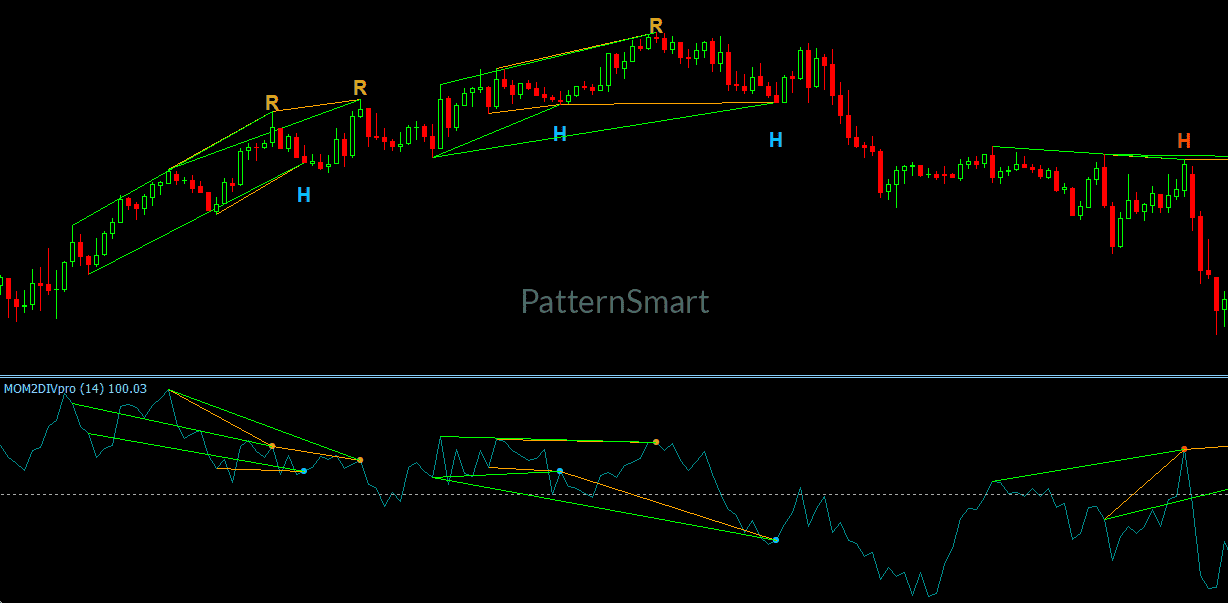
This is where Momentum Double Divergence for MT5 can provide an additional perspective.
The Momentum indicator focuses on the rate of price change. Unlike trend-following indicators that primarily focus on trend direction, Momentum examines how quickly price is changing compared with an earlier period. When combined with PatternSmart’s Double Divergence methodology, it can help traders study momentum acceleration, momentum deceleration, and early market transitions.
Designed for MetaTrader 5, Momentum Double Divergence provides a structured way to compare price behavior with changes in underlying momentum.
The goal is not to predict what the market must do next. Instead, the indicator helps traders identify differences between price movement and momentum that may deserve further analysis.
What Is the Momentum Indicator?
Momentum is a straightforward concept.
It describes how quickly something is changing.
In technical analysis, the Momentum indicator measures how rapidly price is changing relative to a previous period.
This is different from simply asking whether price is moving upward or downward.
Consider two markets:
- Market A is rising slowly.
- Market B is rising rapidly.
Both markets are moving higher, but their momentum is different.
Momentum analysis helps traders examine this difference.
It can also reveal situations where:
- Price continues advancing but momentum slows.
- Price continues declining but downward momentum changes.
- Momentum begins strengthening before price fully responds.
- Momentum changes during an early stage of a market transition.
These characteristics make Momentum particularly useful for studying changing market speed rather than simply identifying trend direction.
What Is Momentum Double Divergence?
A divergence occurs when price and an indicator begin behaving differently.
For example, price might make a new high while Momentum makes a lower high.
Price is still moving upward, but the rate of price change is no longer confirming the movement in the same way.
This difference is called divergence.
PatternSmart’s Double Divergence methodology provides a consistent framework for studying these relationships.
The methodology separates the indicator from the analytical process. The indicator determines what market characteristic is being measured, while the methodology provides the framework for interpreting divergence and evaluating confirmation.
For Momentum, the relevant market characteristic is the rate of price acceleration.
That gives Momentum Double Divergence its particular analytical focus.
Why Use Momentum for Double Divergence?
Every technical indicator provides a different perspective.
For example:
- DMI focuses on directional movement.
- CCI focuses on price deviation from statistical averages.
- MACD focuses on trend development and momentum transitions.
- Money Flow focuses on buying and selling pressure.
- Momentum focuses on the rate of price acceleration.
Momentum therefore asks a relatively simple question:
Is the speed of price movement changing?
When Double Divergence is applied to Momentum, traders can examine whether price continues moving while the underlying rate of change begins behaving differently.
This can provide useful information during developing trends, momentum-driven markets, swing markets, and early trend transitions.
Understanding the Four Types of Double Divergence
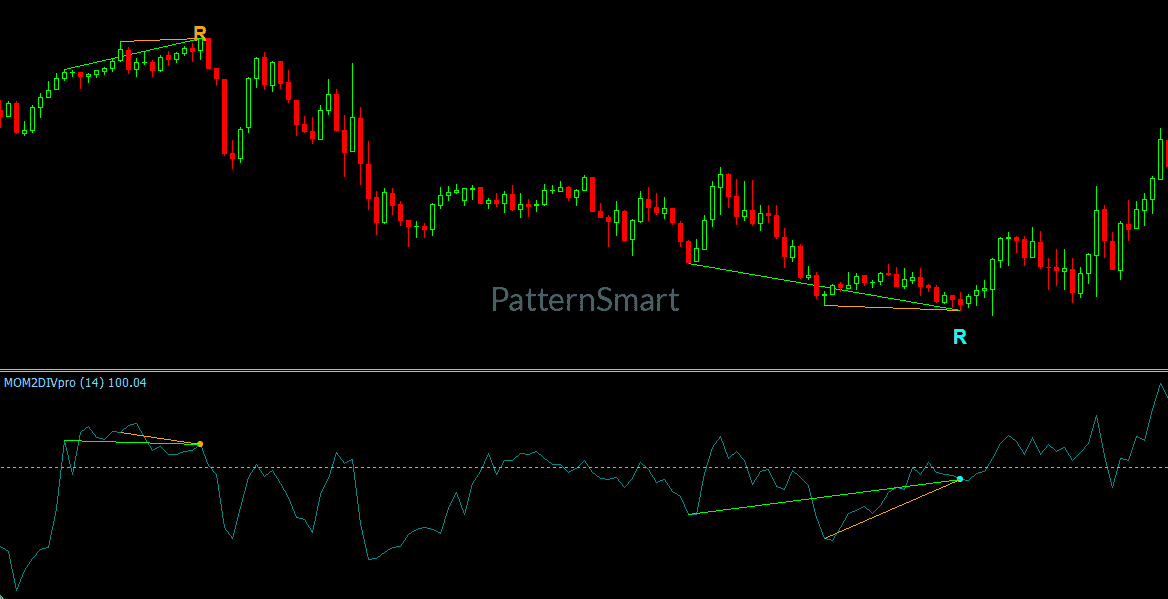
Momentum Double Divergence uses the four standard Double Divergence classifications.
Learning these four types is important because they can provide different types of information.
Regular Bullish Double Divergence
Regular bullish divergence occurs when price makes a lower low while the indicator makes a higher low.
In simple terms, price has moved lower, but Momentum has not moved lower by the same degree.
This can provide evidence that downward momentum is changing.
It does not guarantee that price will reverse upward.
Instead, it gives traders another piece of information to evaluate alongside price action and market structure.
Regular Bearish Double Divergence
Regular bearish divergence occurs when price makes a higher high while the indicator makes a lower high.
Price has continued upward, but Momentum is not confirming the same degree of upward movement.
This can indicate that upward momentum is changing.
Again, this should not automatically be interpreted as a sell signal or guaranteed reversal.
The broader market context remains important.
Hidden Bullish Double Divergence
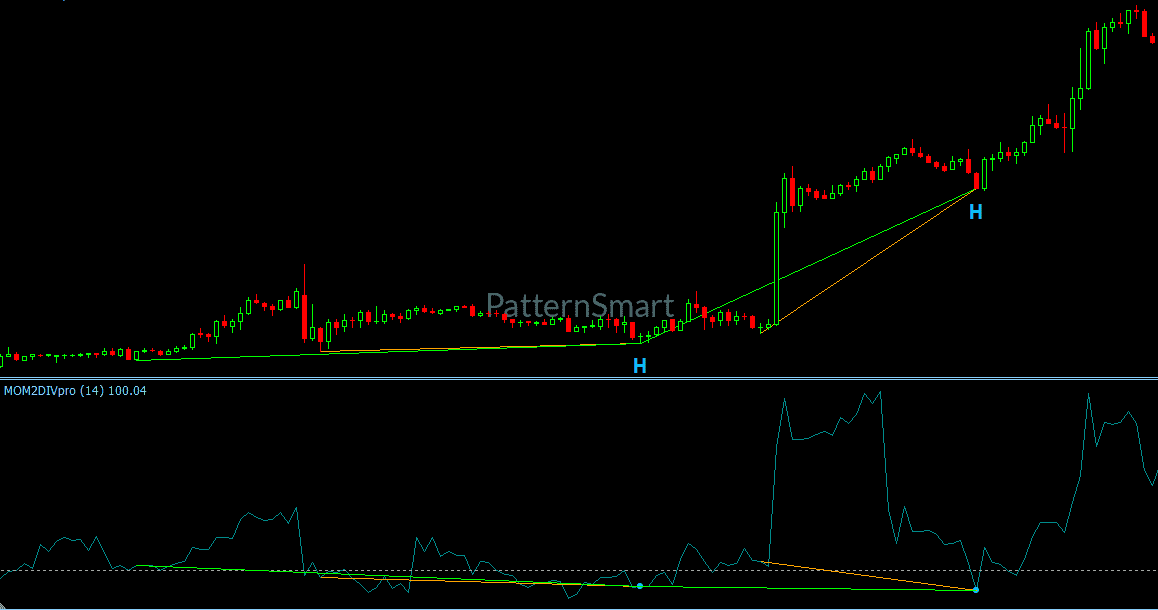
Hidden bullish divergence occurs when price forms a higher low while the indicator forms a lower low.
This type of divergence can provide information about potential continuation within an existing bullish structure.
For example, price may temporarily pull back during a broader upward movement. Momentum may behave differently during that pullback, creating a hidden bullish divergence observation.
The observation can then be evaluated alongside the existing trend and market structure.
Hidden Bearish Double Divergence
Hidden bearish divergence occurs when price forms a lower high while the indicator forms a higher high.
This can provide information about potential continuation within a bearish market structure.
As with all divergence classifications, the signal should be considered part of a broader analytical process rather than treated as an independent prediction.
Momentum Acceleration and Deceleration
One of the easiest ways for beginners to understand Momentum Double Divergence is to think in terms of acceleration and deceleration.
Momentum Acceleration
Momentum acceleration means the rate of price movement is increasing.
For example, a market may begin moving upward slowly and then start advancing more quickly.
Momentum can help identify this change in speed.
Momentum Deceleration
Momentum deceleration means the rate of price movement is slowing.
Price can continue moving upward while the rate of that movement decreases.
This distinction is important because a slowing rate of change does not necessarily mean that price has already reversed.
It simply means that the underlying speed of movement is changing.
Momentum Double Divergence helps traders examine these changes in relation to price structure.
Momentum Double Divergence and Early Market Transitions
Momentum divergence can appear before visible changes in trend development.
This makes it particularly useful when studying early shifts in market sentiment and developing market conditions.
For example, imagine that price has been moving higher for several periods.
The market continues making new highs, but Momentum begins producing weaker readings.
This does not tell us that a reversal must occur.
Instead, it tells us that the relationship between price and momentum has changed.
A trader can then examine:
- Current market structure
- Recent price swings
- Support and resistance
- Higher-timeframe conditions
- Other technical evidence
- Whether additional confirmation exists
This is a much more disciplined approach than reacting to divergence alone.
Momentum Double Divergence for Developing Trends
Momentum can also be useful when a new trend is beginning to develop.
Early in a trend, price movement may not yet look particularly strong.
Momentum may provide additional information about whether the rate of price change is beginning to increase.
When combined with Double Divergence, this creates a framework for comparing developing price structure with developing momentum.
The Indicator Knowledge Base identifies developing trends and early trend transitions as important market conditions for Momentum Double Divergence.
This makes it useful for traders who want to study changes in momentum rather than focusing only on established trends.

When Is Momentum Double Divergence Most Useful?
Momentum Double Divergence is particularly suited to:
- Developing trends
- Momentum-driven markets
- Swing markets
- Early trend transitions
The Indicator Knowledge Base also identifies swing trading, momentum trading, and active discretionary trading as suitable trading styles.
This does not mean the indicator should be restricted to a particular trading style. PatternSmart’s methodology is designed to adapt to different trading styles and timeframes while maintaining the same analytical process.
Important Limitations
Momentum Double Divergence also has limitations that beginners should understand.
The Indicator Knowledge Base notes three important considerations:
- Momentum may produce frequent signals during volatile conditions.
- Confirmation from broader market context remains important.
- Momentum does not directly evaluate overall trend quality.
This is why Momentum should not be treated as a complete market analysis system.
Momentum tells you about rate of price change.
It does not tell you everything about:
- Trend strength
- Market participation
- Volatility
- Support and resistance
- Broader market structure
Other forms of technical analysis may therefore provide complementary information.
A Simple Double Divergence Process
For beginners, PatternSmart’s methodology can be understood as a simple sequence:
1. Observe
Start with price.
Identify the current movement and important swing points.
2. Compare
Compare price behavior with Momentum.
Ask whether Momentum confirms the latest price movement.
3. Confirm
Look for additional technical evidence.
Confirmation can include market structure, price action, support and resistance, or higher-timeframe conditions.
4. Interpret
Determine what the divergence may be communicating about momentum.
5. Evaluate
Consider the complete market picture before drawing conclusions.
This Observe → Compare → Confirm → Interpret → Evaluate process is central to the PatternSmart Double Divergence methodology.
Most importantly, the methodology emphasizes that divergence is not predictive certainty. Technical interpretation remains probability-based, and context is essential.
Flexible Signal Controls
Momentum Double Divergence includes configurable signal-generation controls that allow traders to determine which divergence categories are calculated and displayed.
These include:
- Show Regular Bullish
- Show Regular Bearish
- Show Hidden Bullish
- Show Hidden Bearish
Each setting controls its corresponding divergence type without changing the other divergence categories.
This can be helpful when learning the indicator.
A beginner may initially want to focus on one type of divergence rather than placing too much information on the chart at once.
Wait 1 Bar
Wait 1 Bar controls signal confirmation timing.
When enabled, the indicator waits for an additional completed bar before confirming a detected Double Divergence signal.
This provides an additional confirmation stage, although it can result in later signal confirmation.
The setting belongs to the Signal Generation category and specifically controls signal confirmation timing.
Enhanced Mode and Advanced Controls
For traders who want greater control over signal evaluation, the indicator also includes additional filtering and advanced parameters.
Enhanced Mode
Enhanced Mode belongs to the Signal Filtering category.
It is used as part of the additional validation process applied after divergence signals have been generated.
Divergence Bar Range
Divergence Bar Range is associated with signal filtering and advanced parameter controls.
Divergence Lookback
Divergence Lookback is an advanced parameter related to divergence evaluation.
Filter Length
Filter Length is another advanced parameter used within the indicator’s filtering and calculation process.
The official Inputs Manual identifies these features separately from Signal Generation controls.
This distinction is important: these settings refine signal evaluation; they do not create a different Double Divergence methodology.
[Get Started With Double Divergence Pro for MT5]
Looking for the complete mathematical breakdown, step-by-step optimization guides, and advanced trading strategies? Explore our comprehensive documentation:
Visit the Technical Inputs Manual: Double Divergence Pro for full parameter tuning.
Read the master guide on the Double Divergence Indicator Series.
Keep Your MT5 Chart Organized
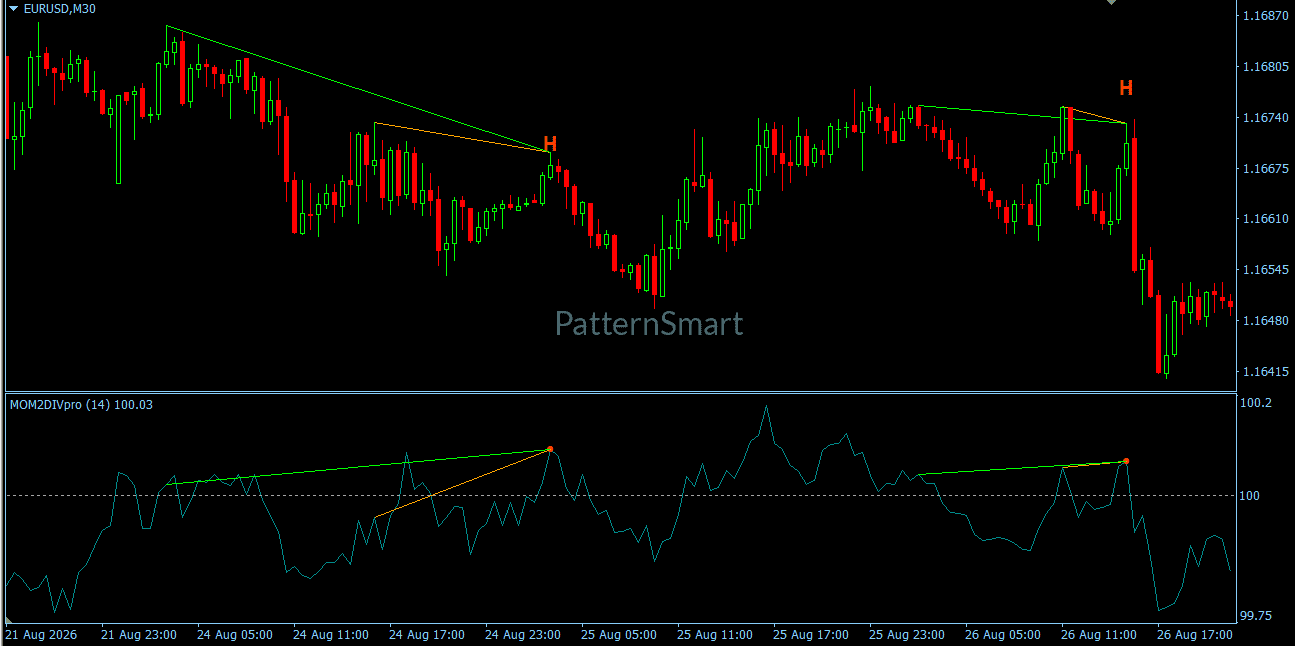
Momentum Double Divergence also includes display and visualization controls.
Available controls include:
- Show Char
- Show Line
- Only Show Last Signal Within Bars
These options allow traders to manage how divergence information is presented on the chart.
For beginners, controlling the amount of historical information displayed can make the chart easier to understand.
The Inputs Manual places these controls within the Display & Visualization category.
Alerts and Notifications
The indicator also provides:
- Enable Alert
- Alert Sound
These features can help traders monitor confirmed signals without continuously watching the chart.
Alerts are workflow and notification features. They do not change the underlying Momentum Double Divergence methodology.
Momentum Double Divergence on MT5
MetaTrader 5 provides the environment in which Momentum Double Divergence is used for chart-based technical analysis.
The PatternSmart methodology is platform independent. The same core analytical process can be applied across supported platforms, including MetaTrader 5. Platform differences affect workflow and user experience rather than the interpretation framework itself.
For MT5 users, Momentum Double Divergence therefore provides a Momentum-focused perspective within an established technical analysis environment.
Frequently Asked Questions
What is Momentum Double Divergence?
Momentum Double Divergence combines the Momentum indicator with PatternSmart’s Double Divergence methodology to study the relationship between price movement and the rate of price change.
What does the Momentum indicator measure?
Momentum measures how rapidly price is changing relative to a previous period. Its emphasis is on the speed of price movement rather than simply identifying trend direction.
What is Momentum divergence?
Momentum divergence occurs when price and Momentum develop different patterns. For example, price may continue rising while Momentum begins weakening.
Does divergence guarantee a reversal?
No. Divergence does not guarantee a reversal or continuation. PatternSmart’s methodology emphasizes confirmation, probability-based interpretation, and market context.
What are the four types of Double Divergence?
The four primary classifications are:
- Regular Bullish
- Regular Bearish
- Hidden Bullish
- Hidden Bearish
Regular divergence can provide information about potential changes in existing movement, while hidden divergence can provide information relevant to continuation analysis.
Can I show only selected divergence types?
Yes. The indicator provides independent controls for Regular Bullish, Regular Bearish, Hidden Bullish, and Hidden Bearish divergence.
What does Wait 1 Bar do?
Wait 1 Bar controls signal confirmation timing by adding an additional completed bar before a detected divergence signal is confirmed when enabled.
Is Momentum Double Divergence suitable for swing trading?
Swing trading is one of the trading styles identified as suitable for Momentum Double Divergence, along with momentum trading and active discretionary trading.
Can Momentum Double Divergence be used for developing trends?
Yes. Developing trends and early trend transitions are specifically identified as relevant market conditions for Momentum Double Divergence.
Why does Momentum sometimes produce many signals?
Momentum may produce frequent signals during volatile market conditions. This is one reason broader market context and confirmation remain important.
Conclusion
Momentum Double Divergence for MT5 provides a clear way to study one important aspect of market behavior: the rate at which price is changing.
By comparing price structure with Momentum behavior, traders can examine:
- Momentum acceleration
- Momentum deceleration
- Changing market sentiment
- Early trend development
- Potential market transitions
The four Double Divergence classifications provide different perspectives, while configurable signal-generation, filtering, visualization, and alert features allow traders to organize the information according to their analytical workflow.
The most important concept for beginners is simple:
Price tells you where the market is moving. Momentum helps you examine how quickly it is moving. Double Divergence helps you compare the two.
A divergence should not be treated as a prediction or an automatic trading decision. Instead, use it as an observation, compare it with price and market structure, seek confirmation, and evaluate the complete technical picture.
That confirmation-first approach is the foundation of PatternSmart’s Double Divergence methodology.